Natural Science
Vol.08 No.08(2016), Article ID:69732,18 pages
10.4236/ns.2016.88040
Advances for Opaque PBR Internally Illuminated for Fiber Optic for Microalgae Production
Deusa A. M. P. da Ponte1,2*, Marcelo M. Werneck1, Donato A. Aranda2
1Laboratório de Instrumentação e Fotônica-LIF, COPPE/Universidade Federal do Rio de Janeiro, Rio de Janeiro, Brazil
2Laboratório GREENTEC, Escola de Química/Universidade Federal do Rio de Janeiro, Rio de Janeiro, Brazil

Copyright © 2016 by authors and Scientific Research Publishing Inc.
This work is licensed under the Creative Commons Attribution International License (CC BY).
http://creativecommons.org/licenses/by/4.0/


Received 4 June 2016; accepted 12 August 2016; published 15 August 2016
ABSTRACT
The production of microalgae in laboratory systems is restricted almost exclusively since 500 mL to 20 liters tanks of transparent materials such as glass and plastic, under fluorescent lamps on shelves. In this work we developed a laboratory system which produced up to 50 liters of micro- algae cultivation with comparable productivity to the traditional system in the laboratory, with the potential to increase productivity scale and lower energy consumption per produced volume. The system is built with opaque plastic tank, and illuminated by Plastic Optics Fiber (POF) and LED. The quality of the biomass grown in the culture system on LED is comparable to the tradi- tional cultivation, with scale-up without increasing the occupied area, only with increased height of the tank. The productivity of the tank on LED to the strain Scenedesmus sp. with a phototrophic cultivation reached productivity of around 20 mg∙L−1∙d−1 and continuing studies may increase further.
Keywords:
Microalgae, Scenedesmus sp., POF Bundle, LED, Biomass, PBR

1. Introduction
The illumination of photobioreactors (PBR) for the cultivation of microalgae in the world is done by the use of solar energy. About 90% of world production of microalgae is held in open tanks, so-called raceways/open- ponds. In such the productivity is significant, but to be opened it becomes more exposed not only to the sunlight but also to contamination by various microorganisms, including some competition with microalgae for the same nutrients or feed them, producing often a lower biomass [1] . Figure 1 shows different raceways around the world.
Currently, the main uses of microalgae are: animal feed, high value drugs, such as carotenes and antioxidants, as well as supplements for human consumption and also biofuels, such as biodiesel and bioethanol. The term micro- algae is related to microscopic size and most is suspended in water (planktonic), although it can be found in the deep ocean, rivers or lakes, benthic [2] and [3] . The light in organisms with carbon dioxide (CO2) is essential to photosynthesis [4] . The potential use of microalgae has attracted interest in growing high-quality search.
The improvement found to reduce the exposure to contamination is the use of closed tanks of transparent materials such as glass or polycarbonate. The use of transparent material is required for the lighting of micro- algae, since the light energy is essential for the growth of most of them. The disadvantage of using this type of system would be the cost of materials, both installation and maintenance. The requirement of constant trans- parency of the material is required for biomass productivity maintenance [5] . Figure 2 shows models of closed systems.
In expectation of lower cost used in closed vessels, tanks in opaque materials are alternatives, such as PVC and polyethylene. In the photoautotrophic culture, i.e. where the presence of light for microbial growth is re- quired, the use of plastic optical fibers-POF allows an internal illumination of the growth of microalgae, eli- minating the use of transparent materials. Richmond (2004) mentioned the alternative use of photobioreactors with optical fibers began in the United States for over 30 years ago from microalgae study for the production of hydrogen gas and light energy was delivered from the concentration of solar mirrors for later delivery to the PBR. Some studies were developed in opaque tanks with optical fibers [6] - [8] . In coming years to 2000, this

Figure 1. (1) Unit cylindrical microalgae cultivation, Auroville, India; (2) Inclined open system inMálaga, Espanha. The levels A, B, C and D are the different compartments to drive cultivation; (3) Raceway tank in Aban Company, Chennai, India; (4) Mixed system of open tanks, calledalga raceway intergrated design (ARID) atArizona University.

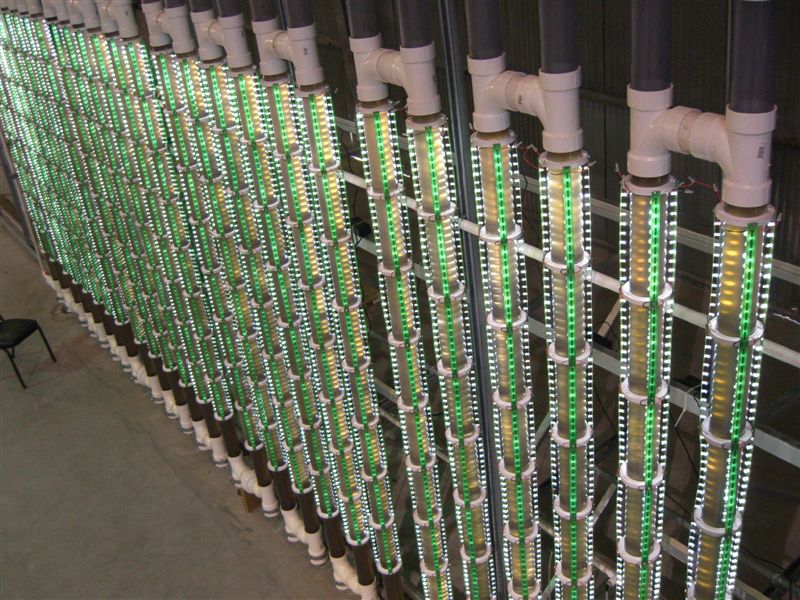
Figure 2. Different closed photobioreactors for production of microalgae in the world [27] - [32] .
concept has been taken over by a small and relevant research center in Japan in microalgae by gas mitigation from the carbon dioxide biofixation and greenhouse gases, including hydrogen production, and understanding was no time told how technically simple to understand, but uneconomical [4] . Other closed tanks can be found with volumes even higher than proposed in this paper, but more complicated set up and system assembly. Some examples are described in [9] .
Thus, in the present work low cost materials were used, such as reused and easy to purchase tanks, in order to reduce the cost in the tank, and some possible improvements were proposed in the internal distribution of fiber internally, in order to bypass the main critical points shown in the literature for such systems, which are: the difficulty of scale-up, mainly due to high cost and also low surface area illuminated by volume of culture [7] and [10] .
The traditional cultivation of microalgae in the laboratory is done through a special type of fluorescent lamp. Figure 3 shows the spectra of different fluorescent lamps. The light traditionally used for the cultivation of microalgae is the daylight type. This model has different luminous intensity energy spectrum of the LED source used in cultivation under LED, which has a higher intensity at a wavelength related to blue (440 - 485 nm). Despite the difference between them in the growth of microalgae perspective, this difference is not a relevant issue as the microorganism grows with the absorbed light energy in the range of 400 - 700 nm, so the most important is the amount of energy to be comparable.
This work carried out was a cultivation system under LED Cool White, two super bright LEDs as light source. They tested two cropping systems were compared to the traditional system of cultivation in the laboratory. To distribute the fibers internally discs were used with holes for the POF. The discs were set one above the other and distributed fibers and kept controlled distance between the lighting points. In the scientific literature the productivity of microalgae is associated, among other factors, the smallest optical path, that is, a shorter distance between the lighting points [11] . Initially it was tested the growth potential of microalgae and based on these data was made increasing scale in a second tank. In the second place, about half the culture was removed and placed in fresh nutrients to continue microalgae production. Furthermore, in order to increase the amount of light dispensed into the tank, it was tested a reflecting surface on the fiber tip to verify a possible potentiation of illumination within the culture through the residual light reflection at the fiber tip without exchanging the source light.
The Photosynthetically Active Radiation (PAR), comprised within the range of 400 - 700 nm, can be understood as irradiance, or radiant energy flow to any source of light energy and is measured in micro mol of photons per square meter second (umolphotons m−2∙s−1). This unit is common to biologists and 4.57 umol photons

Figure 3. Energy spectrum of different types of fluorescent lamps (Sylvania technical bulletin) [33] .
m−2∙s−1 equivalent to 1 Wm−2, considering the sun as a source of light on sunny days [4] and [12] . The ratio depends on the type of light source considered.
The ratio depends on the type of light source considered. They were measured PAR radiation only at the beginning and the end of the cultivation, to avoid exposure of mono-algal culture to possible contamination by other microorganisms. The graph of the behavior of light energy flow within the cultivation of microalgae and is known as exponential decreasing, then the first value is a maximum and occurs as the cell density increased, the amount of light energy available decreases [13] .
This work is the first stage of the project on construction of an internally illuminated PBR through POF and lighting system using a solar tracking, Fresnel lens, in order to concentrate solar energy on the POF bundle. The larger scale tank will include pH control, which will increase the productivity of biomass. The cylindrical tank will have 1000 liters of culture in a lower área (1 m2). The literature describes that designs ofsolar concentration with the transmission of light energy through the optical fibers started in 1980 by a group of French research, but the Project stoppeddue to the high cost of fiber [14] . Over the years solar concentration was subject of interest from different research groups, but in smaller volumes and different types of photobioreactors [7] [15] [16] . The current cost of 1m plastic optical fiber is less than 0.90 US$ and can decrease according to the number of coils purchases as soon as there is a possibility the viability of this type of tank.
2. Materials and Methods
2.1. Microalgae, Culture Medium and Microscopy
The microorganism used in this work was the strain of microalgae Scenedesmus sp. SCIB-01, courtesy of Ecophysiology Laboratory of Toxicology Cyanobacteria (LETC) Institute of Biophysics Carlos Chagas Filho, UFRJ. This microalgae was collected in Lagoa de Ibirité (20˚01'19"S 44˚03'32"O), Minas Gerais and isolated by LETC in 2011; classified by the Department of Botany of the National Museum /UFRJ; and preserved in the collection of microalgae cultures of LETC in ASM-1 medium. All experiments used 1-ASM medium culture [17] . The direct cell count was performed using optical microscope SC30 model (Olympus) and lens with 40× magnification.
2.2. Plastic Optical Fiber (POF), Distribution Discs of POF and Reflective Surfaces
Inside the tank used were 126 POF segments was cut into 117 cm long with 2 mm diameter each (Mitsubishi- ESKA™). The fibers were polished on both sides with sandpaper P600 and P1500 type and also a finish polishing sandpaper to mirror the surface in contact to the crop and with the LED. Inside the tanksit was used two polycarbonate discs with 29 cm diameter each to support and distribute optical fibers homogeneously. Concentric cuts were made on the discs in a similar way to existing openingsas in a Ferris wheel, resulting in 18 rods and their respective gaps between them. In each rod were performed 7 holes at a distance of 2.5 cm between them. Total of 126 holes for distribution of fibers within the tank. The average speed of the fiber in front of the laser beam promoted by pulling machine was 2 cm∙s−1 and the optical laser power used was 7.5 W.
The holes were adjusted to the diameter of POF in the upper disc and the lower disc are slightly larger holes for receiving the rivets with the reflecting surfaces, as shown in Figure 4.
The maximum distance between fibers was 5 cm disc edge, referring exactly to the difference between the rods, and less than 4 mm between the closest center of the disc fibers. The disks were attached through three stainless steel screws 37 cm long. The reflective surfaces used were pieces of stainless steel 2.2 cm long by 2.2 mm. The reflective surfaces in the tank were adjusted based on the lower disk 126 rivets with inside diameter 2.3 mm and about 4 cm long, to ensure better contact “face to face” between the reflective surface and the polished POF. It was placed quick fastening glue after placing the fiber. Similarly, the fibers were polished stainless steel pieces were used for this sandpaper P220, P360, P600 sandpaper and mirroring surface. At the base of the rivets was held a grip to locking pliers. The tightening of the rivet base was needed to prevent the output of the stainless steel pieces.
2.3. Tanks and Apparatus for Aeration
In this work wereused two tanks, one reused to maximum 30l capacity of polypropylene (PP) existing in the laboratory (plastic bucket), and a barrel of 50l in polyvinylchloride―PVC widely used in laboratories for distilled water storage (reservoir). Measurements of the plastic bucket diameters are 28, 30 and 34 cm and height of 40 cm (bottom to top). The barrel with an internal diameter of about 40 cm and 1 meter high (Figure 5(a)).
The apparatus aeration was built through 4 stainless steel pipe connection. The tubes were individually twisted at one end to twist machine, resulting in four pipes connected with semicircles at one end. In each tube was possible injection of compressed air through four hoses in systems with LED (Figure 5(b)). The air flow was measured by flowmeter. The semi-circles were made in diameters of 8, 13, 18 and 23 cm, and semi-circles are concentric. The height of the piece was 33 cm. Small holes were made with 45˚ between them, resulting in 8 holes per semicircle (Figure 6).
2.4. LEDs and Support Brackets of Plastic Optical Fibers
Two super bright LEDs to 50 W and 25 lighting points were used. The LED external measures were 51.6 × 56.1 mm and 4.4 mm in height (model ZM-J50W6P45-10C5BM, Zeme). Each LED has been properly adapted to a heat sink and fan assembly to ensure the integrity of the fiber due to possible overheating. The two supports for connecting the fibers to the LED were made in solidrectangular blocks of aluminum with 64 holes, and these were fixed with four screws to the heat sink.

Figure 4. Design of holes for the optical fibers in the fiber holders and photo of the low tank disc with rivets adjusted to the fibers.

Figure 5. (a) Sequence of the tested tanks (under LED) and (b) laboratory conventional cultivation―LCC and tanks under LED with air intakes and light sources.

Figure 6. Apparatus aeration tanks under LED.
2.5. CO2 Laser, Pulling Machine and PAR Meter
For the drilling of thefiberitwas used CO2 laser (model 48-2, Synrad) withwavelength of 10.6 nm. A convergent lens has also been used in ZnSe to perform the discrete grooves in the fiber. A machine pull was required to maintain the average speed of the fiber during laser drive and ensuring the thickness of the groove in the fiber. The photosynthetically active radiation (PAR) was measured with the laboratory scale radiometer-QSL-2100.
2.6. Traditional System of Microalgae Cultivation in the Laboratory
The traditional system of cultivation of microalgae in the laboratory consisted of cultivation shelves to fluore- scent lamps type daylight 20 W (OSRAM) and transparent gallon polycarbonate 24 L capacity (Nalgene). In flowmeters for compressed air and carbon dioxide. 4 lamps were used. The air intake is controlled by the flow- meter and the amount of air per volume was cultivated under comparable to LED system (Figure 5(b)).
2.7. Cell Growth
Cell growth was accompanied by two traditional tests: cell count directly by microscopy and dry weight test [3] and periods of light and dark (called photoperiod) were 12 hours. Samples were taken at the beginning of each day
2.8. Optical Power Measurement in the POF Tips
The optical power measurements at the ends of POF were taken before and after the groove bya power meter instrument (model 2931C, Newport), under the following conditions: continuous current, wavelength of 488 nm and automatic evaluation range. With the photodiode (model detector 918D, Newport). As a light source to evaluate the effect before and after the groove in the fiber, a simple low-power LED has been used. And to evaluate the reflective surface was used an optical device called 3 dB beam splitter. The 3 dB beam splitter is a simple optical device composed of optical fibers and has the ability to evenly divide the light intensity in- troduced at the leading edge between the two opposite ends. Also used were specially prepared adapters for connectingthe fiberwith 2 mm in diameterto 3 dB beam splitter and moreoverto the detector and source.
2.9. Characterization of the Produced Biomass
They were estimated in all biomass produced after collection, centrifugation and lyophilization using the following methods: oils [18] , total lipids [19] , carbohydrates [20] and proteins [21] .
3. Experimental Procedure
For assembly of the system under LED, POF pieces were cut and polished and have been used in both systems tested under the LEDs (126 units). Following these were scratched by the laser and connected to twosuperbright LEDs through two aluminum blocks with holes for connection and support of the fibers by the LED.
For preparation of the initial inoculum in experiments n.1, n.2 and n.3 initially had a period of activation of cells removed from the incubator and were made with the initial inoculum microalga Scenedesmus sp. among autoclaved ASM-1 in two conditions: traditional and under LED. The experiments were performed sequentially. In n.1 were prepared Laboratory conventional cultivation (LCC1) with 20 L cultivation in a gallon of 24 L capacity of transparent material and that was exposed to four vertical lamps on shelf. Furthermore, in a sterilized and reused bucket were placed: Aeration apparatus, fiber support, the supported optical fiber and 27 L of medium ASM-1 culture. The following were introduced 3 L inoculum with microalgae Scenedesmus sp. (Keep- ing the ratio 1:10 inoculum and culture medium). Then, to increase the amount of radiation in the PAR cultivation reflective surfaces were placed at the bases of the optical fibers inside the tank with water. The reflective surface used was polished stainless steel. And the PAR radiation were measured before and after placement surfaces. The test was performed in ultrapure MilliQ water. From the results of the PAR radiation increases, the cultures were performed 2, 3 and 4 with the introduction of reflecting surfaces at the tip of the fibers.
In the second experiment (n.2) an attempt was made to reproduce the same volume n.1 with the possibility of microalgae production by semi-continuous batch. So it made a 30 L cultivation of 50 L barrel with tap. The barrel for presenting a diameter a bit larger than the diameter of the bucket, the culture volume was slightly below the whole length of the grooves, i.e., the culture was illuminated with the surface, instead of light being delivered internally. Therefore, it was not the best use of light through the slots of the POF, which caused a differentiated lighting in cultivation. Thus, the experiment was conducted n.3 where they were grown 50 L of microalgae cultivation in the barrel.
In the experiment n.4 were two batches, i.e., in exp. n.3 were removed about 25 L of barrel cultivation and added 25 L of ASM-1 fresh culture. The same was done again, totaling two batches in n.4. In the second batch of exp. n.4 happened an intermittent problem in the flow meter and decrease air flow.
The experiments were injected into the compressed air flow: 7 mL∙min−1 in traditional cultures (20 L culti- vation), 10 mL∙min−1 (30 L cultivation) and 16 mL∙min−1 with the barrel 50 L, i.e. maintaining the approximate ratio of 0.3 mL of air per liter of culture. This relationship of air per volume of culture was defined in the n.1 good aeration condition in the bucket under LED after some previous attempts unpromising where microalgae deposits on the tank floor. But a more detailed assessment can be carried out in the future. At the end of each crop biomasses were collected, centrifuged, frozen and freeze-dried. In freeze-dried biomass were characterized total lipid levels, oils, carbohydrates and proteins.
The monitoring of the experiments was done by direct cell count by microscopy and dry weight of biomass. In addition, the photosynthetically active radiation was assessed (PAR) within the tank at the beginning and at the end of crops. And the measurements were made in two different way of farming systems. Inside the tanks under LED, the measurements were performed in 18 positions between the rods, recording the values measured in the region closest to the center of the fiber distribution disks, and also in the most extreme area to discs. In transparent gallon of conventional breeding measures were made in the tank in the central region, the part of the tank nearest to the shelf lamps illuminated at least the area opposite and on both sides of the tank. Furthermore, it was also accompanied by pH variations, injecting manually for 20 s of carbon dioxide gas (99.999%) to 1 mL∙min−1, in the morning and in the afternoon from experiment n.2.
Tests were made to verify the possibility toincrease in light reflection by the reflective surfaces before placement within the tank. These were performed in the laboratory with the use of optical instrument power- meter coupled to the photodiode detector and the 3 dB beam splitter. Thus it was introduced in one of two equivalents ends a source of low intensity LED, just to compare before and after the intensity of reflected light, and equivalent other end connected to the photodiode detector. It is measured initially reflected light in the main point of the beam splitter (background). The following was introduced a piece of polished stainless steel on the main tip and again the measurement was made. For reliable results of optical power, although qualitative, adapters tailored to fit between beam splitter and all other items of this experiment were used. The optical power measurements were performed under the least amount of ambient light as possible in both readings.
There were also measures the electrical current necessary for the operation of the light sources of both systems under LED and traditional. Thus were measured currents used for superbright LEDs and ventilation fans coupled to the heat sinks and also the supply system of 20 W lamp (ballast and lamps). It was also measured voltage available in the culture laboratory.
There were also measured optical powers before and after the groovemadein the POF. For this measurement were cut three fibers 117 cm long and then the ends were polished by polishing abrasives. Grooves were made in two of the three fiber through the laser and the ends were polished again, to avoid any edge.
4. Equations
The principal equations used were biomass productivity and specific growth rate as electric power involved in each of the systems tested. The specific growth rate (μ) was determined in the exponential phase of cell growth curve, according [22] . Equation (1) and Equation (2) are:
 (1)
(1)
 (2)
(2)
and, Pr = productivity (mg∙L−1∙d−1), xf = final dry weight of biomass (mg∙L−1), xi = initial dry weight of the biomass (mg∙L−1), t = time interval (d), µ: specific growth rate (d−1), N2 e N1 = Cell density (cel mL−1) and N2 > N1. The Equation (3) is:
 (3)
(3)
And, P is electric power em Watts, V is voltage (Volts) e i = electric current in Amperes.
5. Results and Discussion
The optical power values at the ends of the optical fibers before and after the groove are shown in Table 1. It is noticed that the values after the groove decreased to 50%. This suggests that part of the light is dissipated through the slot for the cultivation, without excluding the possibility of a small portion of light energy is lost in the modified material by heating the laser beam on the fiber.
The conditions under which the grooves were first empirical, being taken as the best condition where it can visually perceive the light output by the grooves of the fiber and the fiber structure was maintained more resistant to breaking, i.e., the condition where the fibers were less friable and more intense light through the slot. This information may be useful for the study of an optimized condition.
For performing traditional crops quantities lamps and the distance between the sources and culture systems were adjusted so that the amounts of light energy were paired systems in approximate (in between the traditional and LED systems). Although it is known that the sources are not equal, bearing in mind the light intensity spectra for growth effects of microalgae this difference is not significant if the amount of PAR radiation is comparable, and which does not prevent any component in microalgae have different amount. The growth curves of all the experiments are shown in Figure 7. The behavior of LCC1 and LCC3 curves show that cell growth in traditional farming is less compared to growing under LED, i.e. there are more cells in culture under the LED two conditions (BCE). Figure 7(b) shows the impairment of cell growth by the lack of adequate lighting in both the tanks, for different reasons since the traditional culture received less illumination to follow what was present in culture under LED, which was partially illuminated. Thus, it is clear that the lighting deficiency directly affects cell growth. The behavior of the barrel 50l curve was more promising in cell growth than other curves, it showed the highest specific rate of all the experiments, but the continuation of the batch showed that the growth curves showed different performances. The second batch of exp. n.4 was impacted by lower air intake which possibly explains the marked difference in behavior (Figure 7(d) (1) and (2)). Biomass production curves added to the cell growth curves are shown in Figure 8 and the behavior is different.
The behavior on the increase of biomass is different from that cell growth, in most experiments. In LCC1 cell growth accompanies biomass production, which in no case as plastic bucket, since cell growth is more pro- nounced with increased biomass, i.e. greater number of cells than the traditional cultivation LCC1 however with less weight (Figure 8(a) and Figure 8(b)). Cell growth in LCC2 is not so significant but the amount of biomass produced is considerably higher through 350 mg∙L−1, i.e., the small amount of light caused any increase of the mass of micro-organism (Figure 8(c)). The literature notes that under stress, either nutritional or light energy, an increase of biomass of microalgae [5] . The growth curve of biomass 30 L reservoir is also increased, but less than in LCC2 despite the unbalanced cell growth (Figure 8(d)). In exp. n.3 under greater illumination than other experiments, to standard culture LCC3 cell growth is lower than that in LED but the amount of biomass pro- duced is higher (Figure 8(e) and Figure 8(f)), i.e., more cells were grown under LED but are lighter. In both sequential batches in exp. 4 occurs one significant productivity in the first batch, higher than the previous simple cultivation and slightly higher productivity in LCC3 obtained (Table 3). This shows that the amount of light favored the production of this inoculum biomass ratio and higher fresh culture medium [23] . In exp. n.4, the second batch has a slow biomass increase compared to the previous batch, quite possibly because of impaired inlet for a few hours for the first 2 days of growth. What showed the dependence of effective aeration, addition of carbon dioxide availability.
Table 2 shows the values PAR maximum and minimum measured in the different systems under LED, the

Table 1. Results of optical power measurements.
Table 2. Internal PAR radiation in different PBR, traditional and under LED.
*Foam presence.


Figure 7. Cell growth curves of different experiments (a) plastic bucket and LCC 1, (b) 30l reservoir and LCC 2 (c) 50l reservoir and LCC 3 e (d) 50l and batch (1)-(2).
closer to the center of the tank and around the edge positions. In systems matched the initial values PAR radiation were comparable. But in exp. n.2 PAR values were lower in the cultivation under LED and submitted additional PAR radiation at the top of the crop (Table 2) and lower inside of cultivation. In two experiments performed in n.4 initial PAR values were lower than the top n.3 due to the higher number of cells at the start of cultivation, since the cell growth began closer to the exponential growth phase by phase to be where growth is faster. In addition, foaming occurred with fresh medium input to continue the cultivation. In exp.4 the average value in the position nearest the ends of the support with the fibers was 20 umol photons m−2∙s−1, although in some places the present value only 6 umol photons m−2∙s−1 and the nearest the distribution disc center about 75 umol photons m−2∙s−1, this difference is possibly due to the presence of foam, which makes the means of


Figure 8. (a) Curves cell growth and production of biomass of different experiments (a) LCC1 and (b) Plastic Bucket; (b) Curves cell growth and production of biomass of different experiments (c) LCC 2, (d) 30l reservoir, (e) LCC 3, (f) 50l reservoir e (g) 50l reservoir and batch (1-2).
diffraction of light are different. An observation for PAR radiation within the tanks under LED, since the experiments n.1 to 3 and 4 was occurring PAR radiation between 30 and 50 umol photons m−2∙s−1 at the end of the experiments under the LED and the traditional crops is greater range from >1 to about 100 umol photons m−2∙s−1, which may result in physiological changes to the microorganism which can be investigated.
The smallest amount of light in n.2 cultivation resulted in a marked decrease in productivity in growing under LED (Table 3). Then the experiment with the same volume grown in n.1 was not successful, it is necessary to increase the volume. Therefore, it performed exp. n.3 with the production of 50 liters of culture, where the assessment of tank with a tap was made. The two experiments in n.4 served to barrel of assessing the potential for semi-continuous batch production.
The relationship between 1:10 inoculum medium microalgae and ASM-1 culture was tested on previous studies and obtained a better cost-benefit since other more productive tested (1:4) resulted in longer time to beginning of cultivation effective by the largest amount of initial inoculum [11] . In other experiments have observed the same steps of preparation of crops, considering the difference in the volumes grown, except the experiment n.4, being the continuation of the experiment n.3. The pH measurements were doneduring the experiments were between 7.2 and 8.8.
The time considered for productivity calculation was the period of cultivation, with the exception of batches in exp.3 and 4 which were considered 14, 6 and 8 days of culture, respectively. In addition to the yield and specific velocity measurements were also characterized lipid levels, oils, carbohydrates and proteins in the freeze-dried biomass and the results are shown in Table 3. The values of productivity of traditional systems: LCC1 and LCC2 showed slightly different values, probably due the lowest amount of radiation PAR in LCC2. As for the other traditional crops, there were about 53% less radiation PARmax LCC2 in front of LCC3 (the value is 100 in LCC1 and 188 umol photons m−2∙s−1 in LCC2) which impacted the productivity results in LCC2. The LCC1 and LCC3 crops were subjected to different PAR radiation values which resulted in a slightly higher LCC3 of productivity LCC1.
Most of the results obtained for total lipid content is comparable, but differences were observed likely to be a non-exhaustive extraction method, i.e., the obtained values represent the minimum to be fetched may be considered semi method quantitative. Despite lower the total lipid content found in exp.3 for reservoir 50 L, this difference can be further investigated because the continuity of the experiment in exp.4, the total lipid content obtained in the two sequencing batch showed levels between 14% and 17% i.e. comparable to other results. Soon perhaps the repetition can clarify the issue.
The Tukey-Kramer procedure [24] suggests that there is significant evidence of differences between pairs:
Table 3. Characterization of the produced biomass and biomass yields.
*LCC: Laboratory conventional cultivation. **Problems with aeration.
Plastic Bucket and LCC2, reservoir 30 L and 50 L, reservoir 50 L and LCC2 and, reservoir 50 L and batch n.1. The oil content not found sufficient statistical evidence to prove differences between all the results.
The LED under tank productivity in the most optimized n.3 conditions was not comparable to the shelf, but the continued cultivation showed that productivity was slightly higher than the traditional cultivation (exp.4). The featured content: total lipids, oils, carbohydrates and protein were also comparable in matched systems under LED and LCC, except exp.3 especially as the total lipid content. That indicates that the biomass obtained has similar characteristics.
In evaluating the optical reflecting surface, of optical power results showed that reflection of light at the fiber tip favored significant increase illumination. The values obtained before placing the reflector surface were 73.75 ± 0.1 nW, considered background of the experiment. This amount of energy as is inherent in the reflection of light in optical fiber Beamsplitter in contact with air at one end, resulting from the difference between the means: plastic optical fiber and air. Next, after the introduction of the reflecting surface of the optical power value changed to 757.9 ± 1.9 nW, or more than ten times the background obtained in reflection. Thereafter then assembly of the system was carried out using reflective surfaces fibers from exp.2, even if the increase could be observed of the same order of magnitude in order that the experiments were carried out in completely different conditions.
The evaluation of the PAR radiation inside the tank by placing the reflecting surfaces was performed in Milli-Q ultrapure water and the increase was from 50% to 70%, maintaining the same power LEDs super bright (Table 4).
After input of inoculum to the minimum and maximum values are for 46 up to 180 umol photons m−2∙s−1. The cell concentration in this condition was 105 cel mL−1.
The fiber distribution disk was efficient because it favored the aeration cultivation and allowed a repre- sentative PAR radiation measurement within the crop. The empty spaces between the rods facilitated the move- ment of the crop in the tank by injection of compressed air, and reduced the possibility of microalgae deposits inside the tank. Many previous designs have been tested but the reduction of moving parts favored movement of the crop in the tank. Even after all the crops in the experiments n.3 and 4 was not observed significant deposit of microalgae. The maximum distance between the fibers within the disc is at most 5 cm, because it is the optical path mentioned as most promising, or more productively in many articles mentioned in [25] .
The electric current values in systems under LED and traditional showed lower energy consumption for the system under LED. The measurement of voltage laboratory power supply was confirmed at 123.4 Volts and currents added fans and the LEDs were 1.488 A and resulted in 183.62 W spending electric power (Equation (3)). In the traditional system (LCC) with four lamps and their ballasts the total current was 0.720 A with the same voltage, so the resulting electrical power was 89 W. However, as the volumes of the different systems are energy advantage of LED use results in theoretical 17.5% of electricity savings, considering the volumes under LED 50 L and 20 L for the traditional system (LCC).
Table 4. Conditions before and after reflective surface on the POF tip.
*PC: center of the vessel. **Pb: edge of the reservoir.
6. Conclusions
It is possible to produce microalgae in low cost tanks opaque, internally lighted through optical fibers. The quantity of biomass can be compared to traditional cultivation in the laboratory which is maintained the same amount of light, starting an amount of microalgae cells nearest the exponential portion of the growth curve. The tank on LED has potential for improvement with increased grown volume besides productivity, since there are tanks with a diameter close to the rated but higher which allows for increased volume cultivated. The energy expenditure of the system under LED offers better conditions than the traditional system. To scale up it is essential to control the pH, since the growth intensified the amount of carbon dioxide also increases. In a work carried out in 2014 in the same laboratory [23] that strain showed higher productivity in a smaller volume (about 800 mL) under PAR lighting 400 umol photons m−2∙s−1 with nutrition and aeration conditions comparable to the experiment conducted in this work. Thus, probably the greatest amount of light in the fiber optic system allows even higher biomass productivity. The yield obtained previously was 124 mg∙L−1∙d−1 while the yield obtained in this work was about 20 mg∙L−1∙d−1. Thus, the LED system is comprised with growth potential and with the advantage of increased volume. For that some improvements are possible as: best fit between the points of illumination of LEDs and the ends of the fibers. In this work two LEDs were used and these were twenty-five lighting points. However, the metal brackets that supported the POFs are designed to support the number of fibers necessary to the tank to maintain optimal intervals. Thus, as the number of lighting points (25 each) and the number of lit fibers (126) happened a differentiated lighting of the fibers, then the fibers and lighting points were not “face to face” as desired, causing loss of light immediately on the LED and POF contact. An im- provement in this respect could reduce the number of optical fiber present, which would decrease the cost.
And yet, further study on the speed of the machine to pull and power value dispensed by the laser to perform the slot in the fiber. Improvements in the slot so that the light delivered at the end of the fiber was dispersed in the cultivation and did not arrive at the other end of the POF, and without prejudice to the integrity of the material.
Another possible improvement would be to conduct a thin film on the fiber tip, which allows the light that should arrive at the tip; this was reflected on the metal film deposited by making the reference light through the grooves, which promote an increase of lighting without the need to change the source, and also replace the need for contact of the fiber with a reflective surface in the submerged tip, decreasing light losses. Another further evaluation is the photosynthetic efficiency of the system. This evaluation system under different light intensities is required [26] .
The best fit of distribution disks of the fibers is in the working tank. In this work it was accepted the difference between the existing diameter of the disc and the tank with tap (exp. n.2 to 4) because the discs were initially designed for the tested bucket (n.1). Despite the acceptable difference, less than 5 cm from the disc edge to the walls of the tank, certainly a better fit adjustment could bring better productivity.
Cite this paper
Deusa A. M. P. da Ponte,Marcelo M. Werneck,Donato A. Aranda, (2016) Advances for Opaque PBR Internally Illuminated for Fiber Optic for Microalgae Production. Natural Science,08,341-358. doi: 10.4236/ns.2016.88040
References
- 1. Borowitzka Armin, M. and Moheimani Reza, N. (2013) Algae for Biofuels and Energy Developments in Applied Phycology 5. In: Borowitzka, M.A., Ed., Algae for Biofuels and Energy, Preface, Springer Dordrecht Heidelberg New York London.
http://dx.doi.org/10.1007/978-94-007-5479-9 - 2. Lee, R.E. (2008) Phycology. 4th Edition, Cambridge, UK.
- 3. Lourenço, S.O. (2006) Cultivo de Microalgas Marinhas: Princípios e Aplicações. Rima Artes e Textos, São Carlos.
- 4. Richmond, A. (2004) Handbook of Microalgal Culture: Biotechnology and Applied Phycology (Blackwell). Blackwell Publishing Company, Iow.
www.blackwellpublishing.com - 5. Grobbelaar, J.U. (2008) Factors Governing Algal Growth in Photobioreactors: The “Open” versus “Closed” Debate. Journal of Applied Phycology, 21, 489-492.
http://dx.doi.org/10.1007/s10811-008-9365-x - 6. Javanmardian, M. and Palsson, B. (1991) High-Density Photoautotrophic Algal Cultures: Design, Construction and Operation of a Novel Photobioreactor System. Biotechnology, 38, 1182-1189.
http://onlinelibrary.wiley.com/doi/10.1002/bit.260381010/abstract
http://dx.doi.org/10.1002/bit.260381010 - 7. Ogbonna, J.C., Soejima, T. and Tanaka, H. (1999) An Integrated Solar and Artificial Light System for Internal Illumination of Photobioreactors. Journal of Biotechnology, 70, 289-297.
http://www.ncbi.nlm.nih.gov/pubmed/11536908 http://dx.doi.org/10.1016/S0168-1656(99)00081-4 - 8. Pulzl, O., Gerbsch, N. and Buchholz, R. (1995) Light Energy Supply in Plate-Type and Light Diffusing Optical Fiber Bioreactors. Journal of Applied Phycology, 7, 145-149.
http://dx.doi.org/10.1007/BF00693061 - 9. Fernandes, B.D., Dragone, G.M., Teixeira, J.A. and Vicente, A.A. (2010) Light Regime Characterization in an Airlift Photobioreactor for Production of Microalgae with High Starch Content. Applied Biochemistry and Biotechnology, 161, 218-226.
http://dx.doi.org/10.1007/s12010-009-8783-9 - 10. Singh, R.N. and Sharma, S. (2012) Development of Suitable Photobioreactor for Algae Production—A Review. Renewable and Sustainable Energy Reviews, 16, 2347-2353.
http://dx.doi.org/10.1016/j.rser.2012.01.026 - 11. Pegallapati, A.K., Arudchelvam, Y. and Nirmalakhandan, N. (2012) Energy-Efficient Photobioreactor Configuration for Algal Biomass Production. Bioresource Technology, 126, 266-273.
http://dx.doi.org/10.1016/j.biortech.2012.08.090 - 12. Thimijan, R.W. and Heins, R.D. (1983) Photometric Radiometric and Quantum Light Units. American Society for Horticultural Science, 18, 5.
www.ncbi.nlm.nih.gov - 13. Bryant, D.A. (1994) Advances in Photosynthesis: The Molecular Biology of Cyanobacteria (Springer S). 1994 Edition, Springer.
- 14. Kandilli, C. and Ulgen, K. (2009) Review and Modelling the Systems of Transmission Concentrated Solar Energy via Optical Fibres. Renewable and Sustainable Energy Reviews, 13, 67-84.
http://dx.doi.org/10.1016/j.rser.2007.05.005 - 15. Masojídek, J., Sergejevová, M., Rottnerová, K., Jirka, V., Korecko, J., Kopecky, J., Zatková, I., Torzillo, G. and Stys, D. (2008) A Two-Stage Solar Photobioreactor for Cultivation of Microalgae Based on Solar Concentrators. Journal of Applied Phycology, 21, 55-63.
http://dx.doi.org/10.1007/s10811-008-9324-6 - 16. Mousazadeh, H., Keyhani, A., Javadi, A., Mobli, H., Abrinia, K. and Sharifi, A. (2009) A Review of Principle and Sun-Tracking Methods for Maximizing Solar Systems Output. Renewable and Sustainable Energy Reviews, 13, 1800- 1818.
http://dx.doi.org/10.1016/j.rser.2009.01.022 - 17. Gorhan, P.R., Hammer, V. and Kim, W.K. (1964) Isolation and Culture of Toxic Strains of Anabaena Flos-Aquae (Lyngb.) de Bréb. Verhandlungen der Internationalen Vereinigung fur Theoretische und Angewandte Limnologie, 15, 796-804.
- 18. IDF (International Dairy Federation) (1986) Cheese and Processed Cheese Product. Determination of Fat Content- Gravimetric Method (Reference Method). Standard FIL-IDF 5B: 1986. International Dairy Federation, Brussels, Belgium.
- 19. Bligh, E.G. and Dyer, W.J. (1959) A Rapid Method of Total Lipid Extraction and Purification. Canadian Journal Biochemistry Physiology, 37, 911-917.
http://dx.doi.org/10.1139/o59-099 - 20. Dubois, M., Guilles, K.A. and Hamilton, J.K. (1956) Calorimetric Method for the Determination of Sugars and Related Substances. Analytical Chemistry, 18, 350-356.
http://dx.doi.org/10.1021/ac60111a017 - 21. Association of Official Analytical Chemists—AOAC (1995) Official Methods of Analysis. 16th Edition, AOAC, Arlington.
- 22. Andersen, R.A. (2005) Algal Culturing Techniques (Ed. Elsevi).
- 23. Hakalin, N.L.S. (2014) Otimização das condições de cultivo da Microalga Scenedesmus sp. para a produção de biodiesel.
- 24. Levine, D.M., Stephan, T.C. and Krehbiel, M.L.B. (2005) Estatística—Teoria e Aplicações. Usando o microsoft Excel em português (Terceira E). LTC Editora.
- 25. Slegers, P.M. (2014) Scenario Studies for Algae Production. Wageningen University.
- 26. Marchetti, J., Bougaran, G., Le Dean, L., Megrier, C., Lukomska, E., Kaas, R., Olivo, E., Baron, R., Robert, R. and Cadoret, J.-P. (2012) Optimizing Conditions for the Continuous Culture of Isochrysis affinis Galbana Relevant to Commercial Hatcheries. Aquaculture, 326-329, 106-115.
http://dx.doi.org/10.1016/j.aquaculture.2011.11.020 - 27. http://www.et.byu.edu/~wanderto/homealgaeproject/biofuels3.gif
- 28. http://www.nanovoltaics.com/sites/default/files/styles/large/public/column_reactor_0.png?itok=trKCFjJj
- 29. http://www.oilgae.com/blog/wp-content/uploads/2011/06/photobio_reactors_wide_1.jpg
- 30. http://www.algaeindustrymagazine.com/wp-content/uploads/Horizontaltubular575.jpg
- 31. http://bbi-biotech.com/wp-content/uploads/Products/Photobioreaktor/Photobioreaktor-PBR-4000-G.jpg
- 32. http://biofuelstp.eu/images/bs-algae-large.jpg
- 33. https://assets.sylvania.com/assets/documents/FAQ0074-0605.844b0c66-0b11-44c1-b6b5-32218c3e6d08.pdf
NOTES

*Corresponding author.