Performance Characteristics of Pollutants along the Longitudinal Profile of a Subsurface Flow Constructed Wetland Domestic Sewage Treatment Plant in the University of Lagos, Nigeria ()
All over the world, much wastewater is being generated and most of it, especially in developing countries, is not treated before being discharged into water bodies. Aquatic ecosystems are used either directly or indirectly as recipients of potentially toxic liquids from domestic, agricultural and industrial wastes [1]. Untreated or partially treated wastewater release is harmful to the environment, thus wastewater discharge should be regulated to protect the environment. About two-thirds of the population in developing countries have no hygienic means of disposing excreta and total wastewater which implies that inadequate sanitation is the prime cause of disease in such countries.
For more than two decades, countries have used constructed wetlands to improve the quality of contaminated water and wastewaters [2-4]. Constructed wetlands have successfully been used for environmental pollution control despite the fact that it was initially designed for use in domestic wastewater [5]. A constructed wetland system has the positive characteristics of a natural wetland and it duplicates the physical, chemical and biological processes in the natural system [6]. Constructed wetlands are artificial wastewater systems consisting of shallow ponds or channels which have been planted with aquatic plants and which act as biofilters through natural microbial, biological, physical and chemical processes to treat wastewater [7].
The plants in wetlands help to trap sediment because it allows the sediments to settle at lower velocities. The settlement of particles is also aided by laminar flows in most wetlands [8]. Also, gravity and differences in relative densities of suspended material allow particles to settle in the wetland [9]. Microorganisms in wetland soils take up and store nutrients and use them for metabolic functions which are crucial in organic pollutant removal. The bacteria use the carbon found in organic matter as an energy source and convert to carbon dioxide under aerobic conditions and to methane under anaerobic conditions. The microbial metabolism is the basis of removal of inorganic nitrogen [8].
The two major types of constructed wetlands are the Surface flow constructed wetland (SFCW) and the subsurface flow constructed wetland (SSFCW). The SFCW consists of a shallow basin, soil or other medium to support the roots of vegetation, and a hydraulically designed structure to maintain laminar flow of the sewage. The sewage water is opened to the atmosphere and mostly planted with floating wetland/aquatic plants. The SSFCW consists of a basin charged with a porous medium of graded gravel and sand. The water level is designed to remain below the top of the substrate. Constructed Wetlands can be a single cell basin. They can also be multiple cells connected in parallel or in series depending on configuration of available land space. Constructed wetlands are known to have a high buffering capacity. Effluent quality is therefore normally quite stable. Processes of pollutants removal include sedimentation, adsorption, complexation, uptake by plants, and microbially-mediated reactions including oxidation and reduction [10]. On the other hand, adverse effects can be expected from low temperatures (especially inhibition of N-removal), peak flows (wash out of solids) and clogging of subsurface flow systems. Removal percentages are mainly dependent on temperature, hydraulic residence time (HRT) and loading rate [11].
In this paper, a subsurface flow constructed wetland, connected in series, used for the treatment of the domestic wastewater in the University of Lagos is studied to determine the pollutants’ performance characteristics along its longitudinal profile.
2. Materials and Methods
2.1. Study Area
The University of Lagos, Lagos Nigeria (Unilag) is located in Lagos on 06˚25'N 03˚27'E on the West African Coast and has a direct link to the Lagos lagoon (Figure 1).
2.2. Description of Unilag Subsurface Constructed Wetland
The domestic sewage from the University community is conveyed in sewers to the central sewage inception chamber located at Services Area of the University. The sewage is pumped into two oxidation tanks. Large particles are screened off in a Screen/Grit Removal Chamber before moving into an anaerobic digester (Septic Tank) and then to the constructed wetland system (Figure 2). The wetland was achieved in reinforced concrete and lined with waterproof membrane to avoid infiltration and ground water pollution. The selection of the total area of the SSFCW was based on the model proposed by [12]. The total area of the SSFCW is 7200 m2 with an average sewage influent of 380 m3/day. There are a total of nine (9) cells, each cell an area of 800 m2 and a depth of 0.65 m. The nine cells are subsurface horizontal flow constructed wetland and contain different sizes of gravel and ocean sharp sand as the wetland media of average grade size 0.1 mm to 0.35 mm and planted with Cyprus papyrus. Figure 2 is the layout of the Constructed Wetland Sewage Treatment system
2.3. Sample Collection and Analysis
From January to December 2012 (52 weeks), three samples collected weekly at each of the Sample Points 1 to 11 (SP1-SP11) along the longitudinal profile of the constructed wetland system and taken to the laboratory for analysis. The mean values of each sampling point were recorded. The colour of the sample was measured using multi-parameter photometer after filtering using Whatman No. 42 filter paper. The conductivity, Turbidity, pH and total dissolved solids were measured using the Adwa conductivity meter, Hanna microprocessor turbidity meter, Beckman 350 pH meter and HM digital TDS meter respectively. Chemical and biological analyses were carried out for different parameters as stated for each parameter in Standard Methods of Water and Waste Water Analysis. Results of laboratory were further subjected to

Figure 1. Map of the University of Lagos.
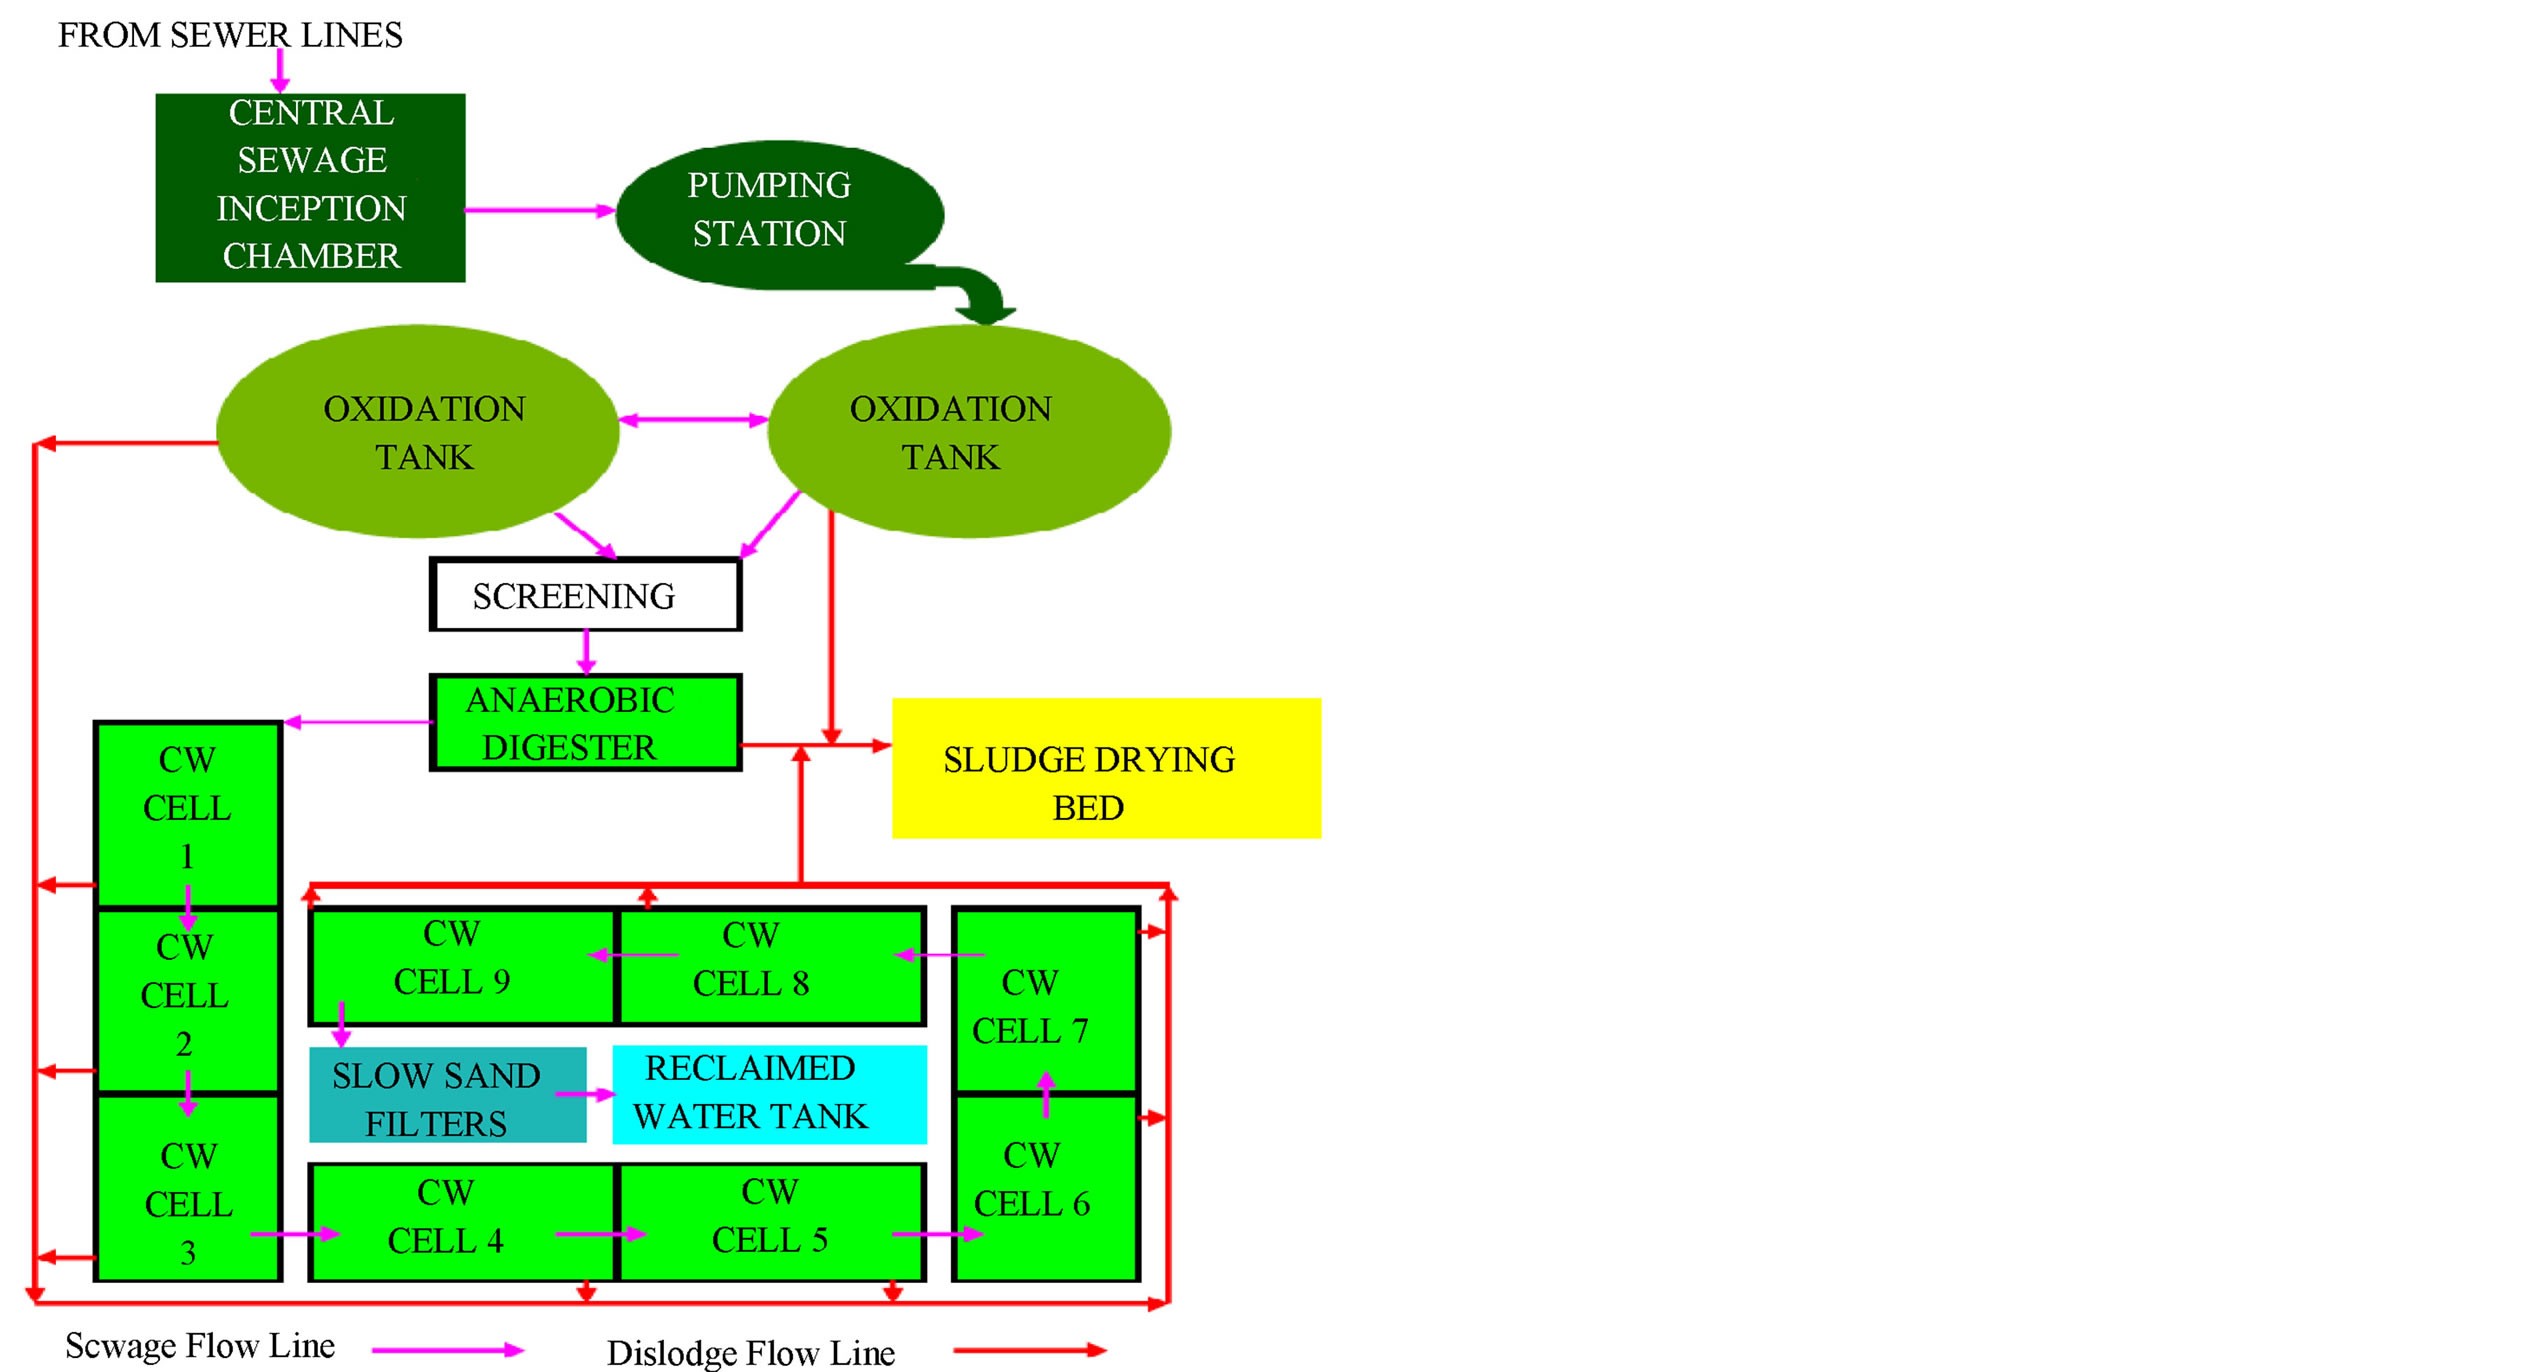
Figure 2. Layout of Unilag constructed wetland sewage system.
statistical analysis for means and standard deviations and presented in Table 1. Figure 3 shows the sketch of the longitudinal profile of the SSFCW and the sampling points.
3. Results and Discussion
3.1. General Results
The statistical analysis for means and standard deviations of the data collected for one year, are presented in Table 1 below for each of the pollutant parameters investigated.
Table 2 shows the percentage removal of the pollutants at the sampling points along the longitudinal profile of the SSFCW. It is observed that, although the SSFCW sewage treatment plant is designed and constructed in 9 cells connected in series, significant percentage of the pollutants have been removed at the end of cell 7, sampling point 8 (Table 2). The percentage reduction varies from 42.27% for Sulphate and 99.95% for Turbidity. For parameters that require desirable increase in levels, pH increased by 9.30%, while the Dissolved Oxygen in-creased by 138.53% (Table 2 and Figure 4). In Table 3 the performance of all the parameters, at the effluent point, of the SSFCW were compared with the FEPA guidelines for the Effluent Limitation for water to be discharged into receiving bodies of water in Nigeria. From the Table 3, it is observed that all the parameters are acceptable for discharge into the receiving water in accordance with FEPA Guidelines. The performance of each of the pollutant parameters are further discussed in the next section.

Table 1. Mean values of parameters analysed in the domestic wastewater at sampling points along the SSFCW.

Table 2. % Removal of the pollutants at sampling points along the SSFCW profile.
3.2. Performance of Physical Pollutants Parameters
3.2.1. pH
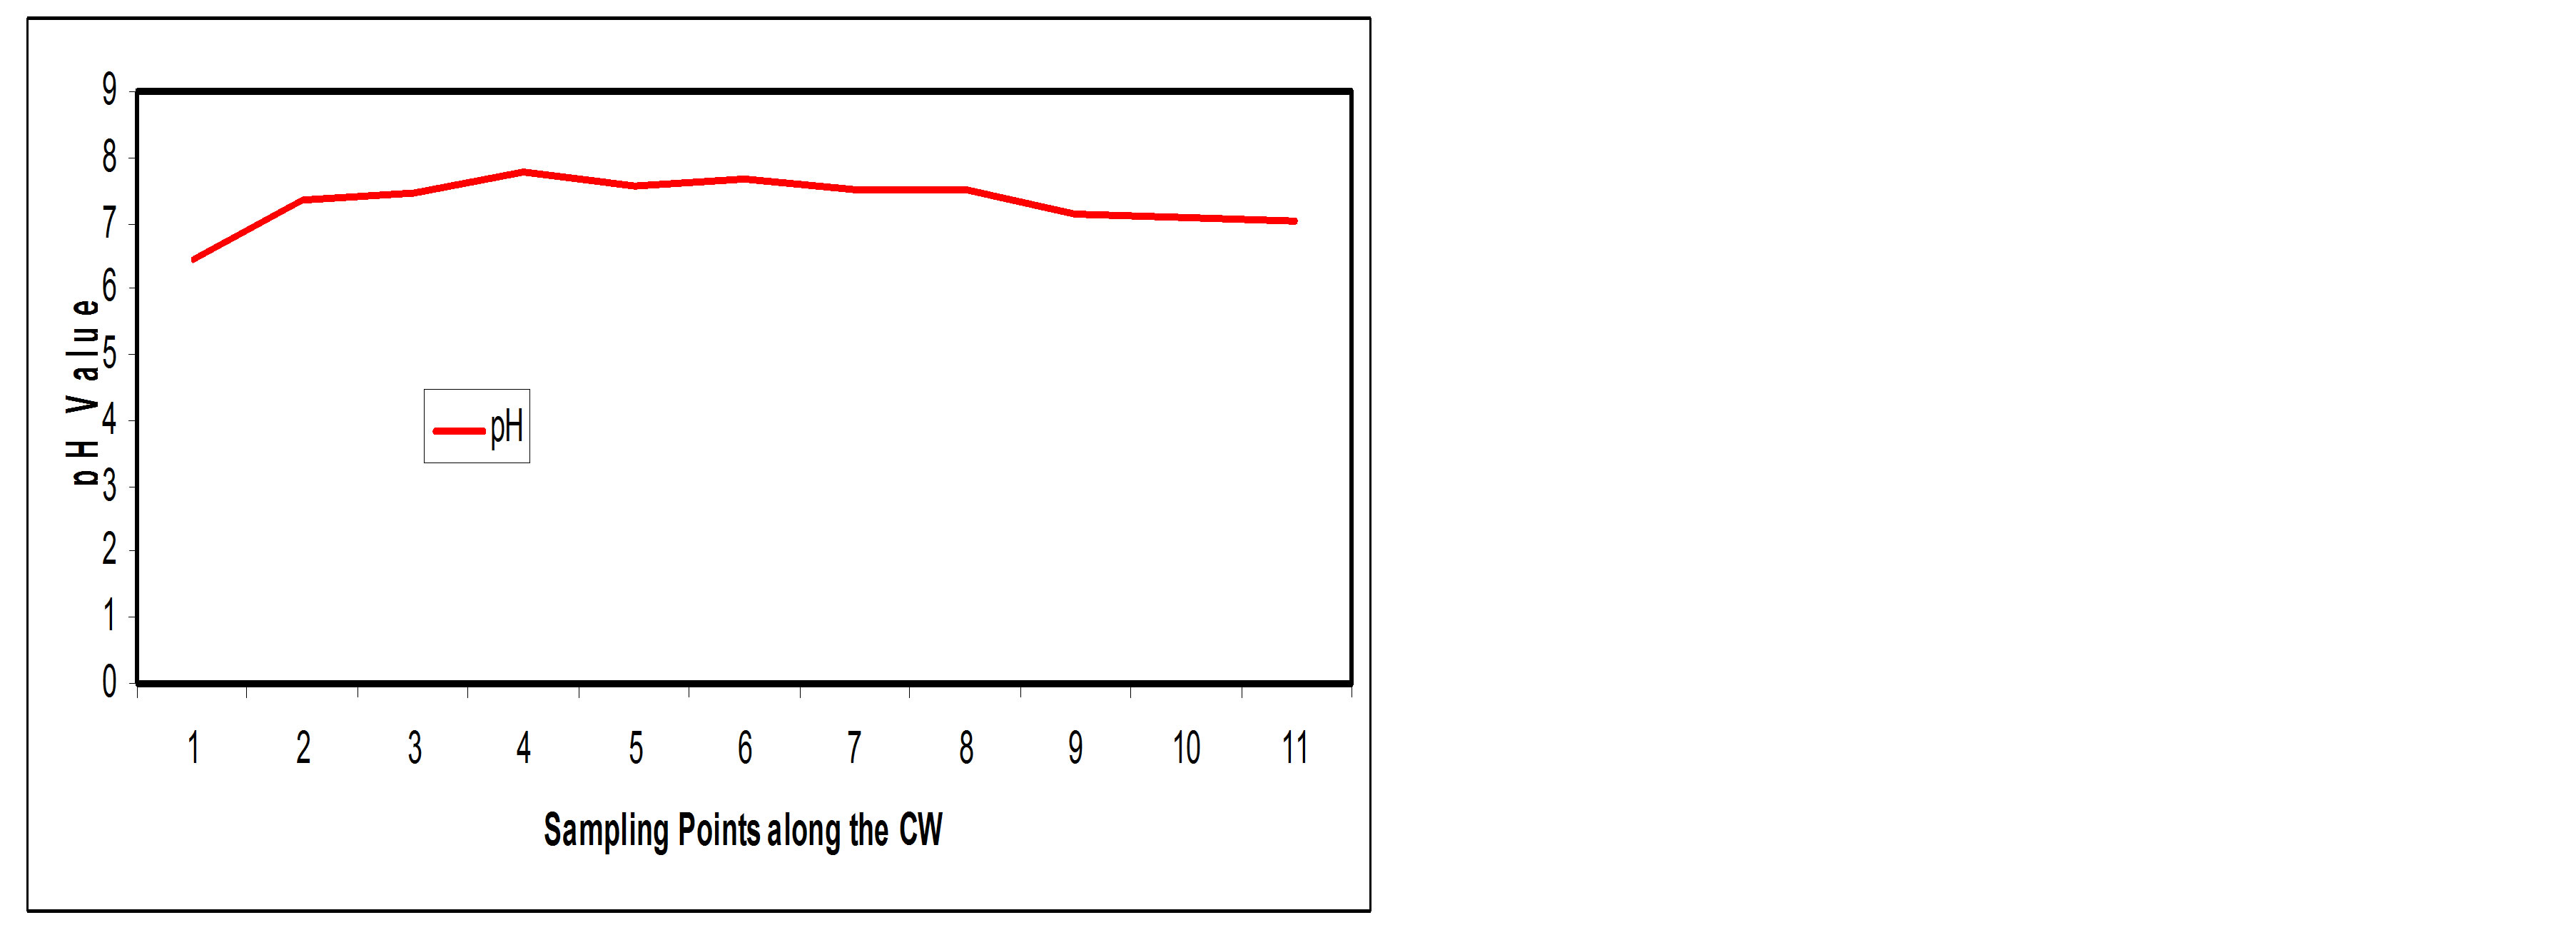
Figure 5(a) shows the pH pattern along the SSFCW indicating that there was no appreciable difference in in fluent pH value (6.49) and effluent pH value (7.05) and both are within FEPA standards (Table 3). The SSFCW system seems to reduce the acidity of the effluent water and thus it become more conducive for the aquatic life of
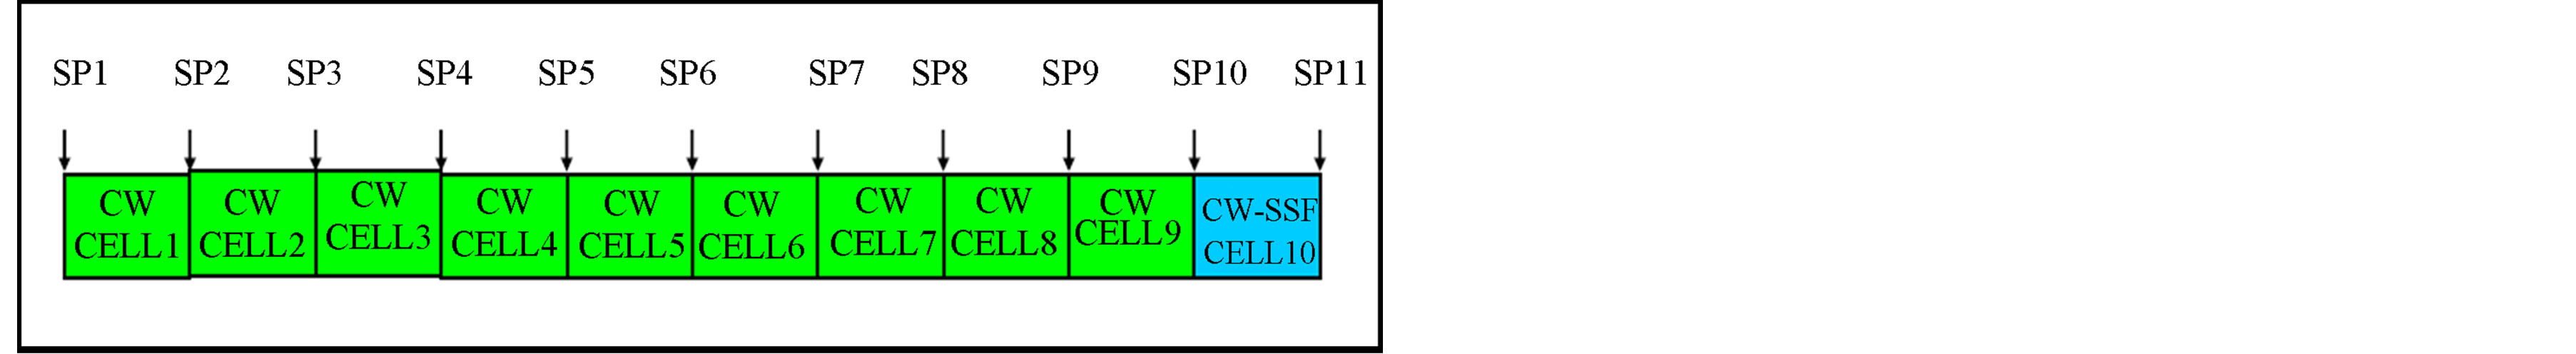
Figure 3. Sampling points along the longitudinal profile of the constructed wetland.
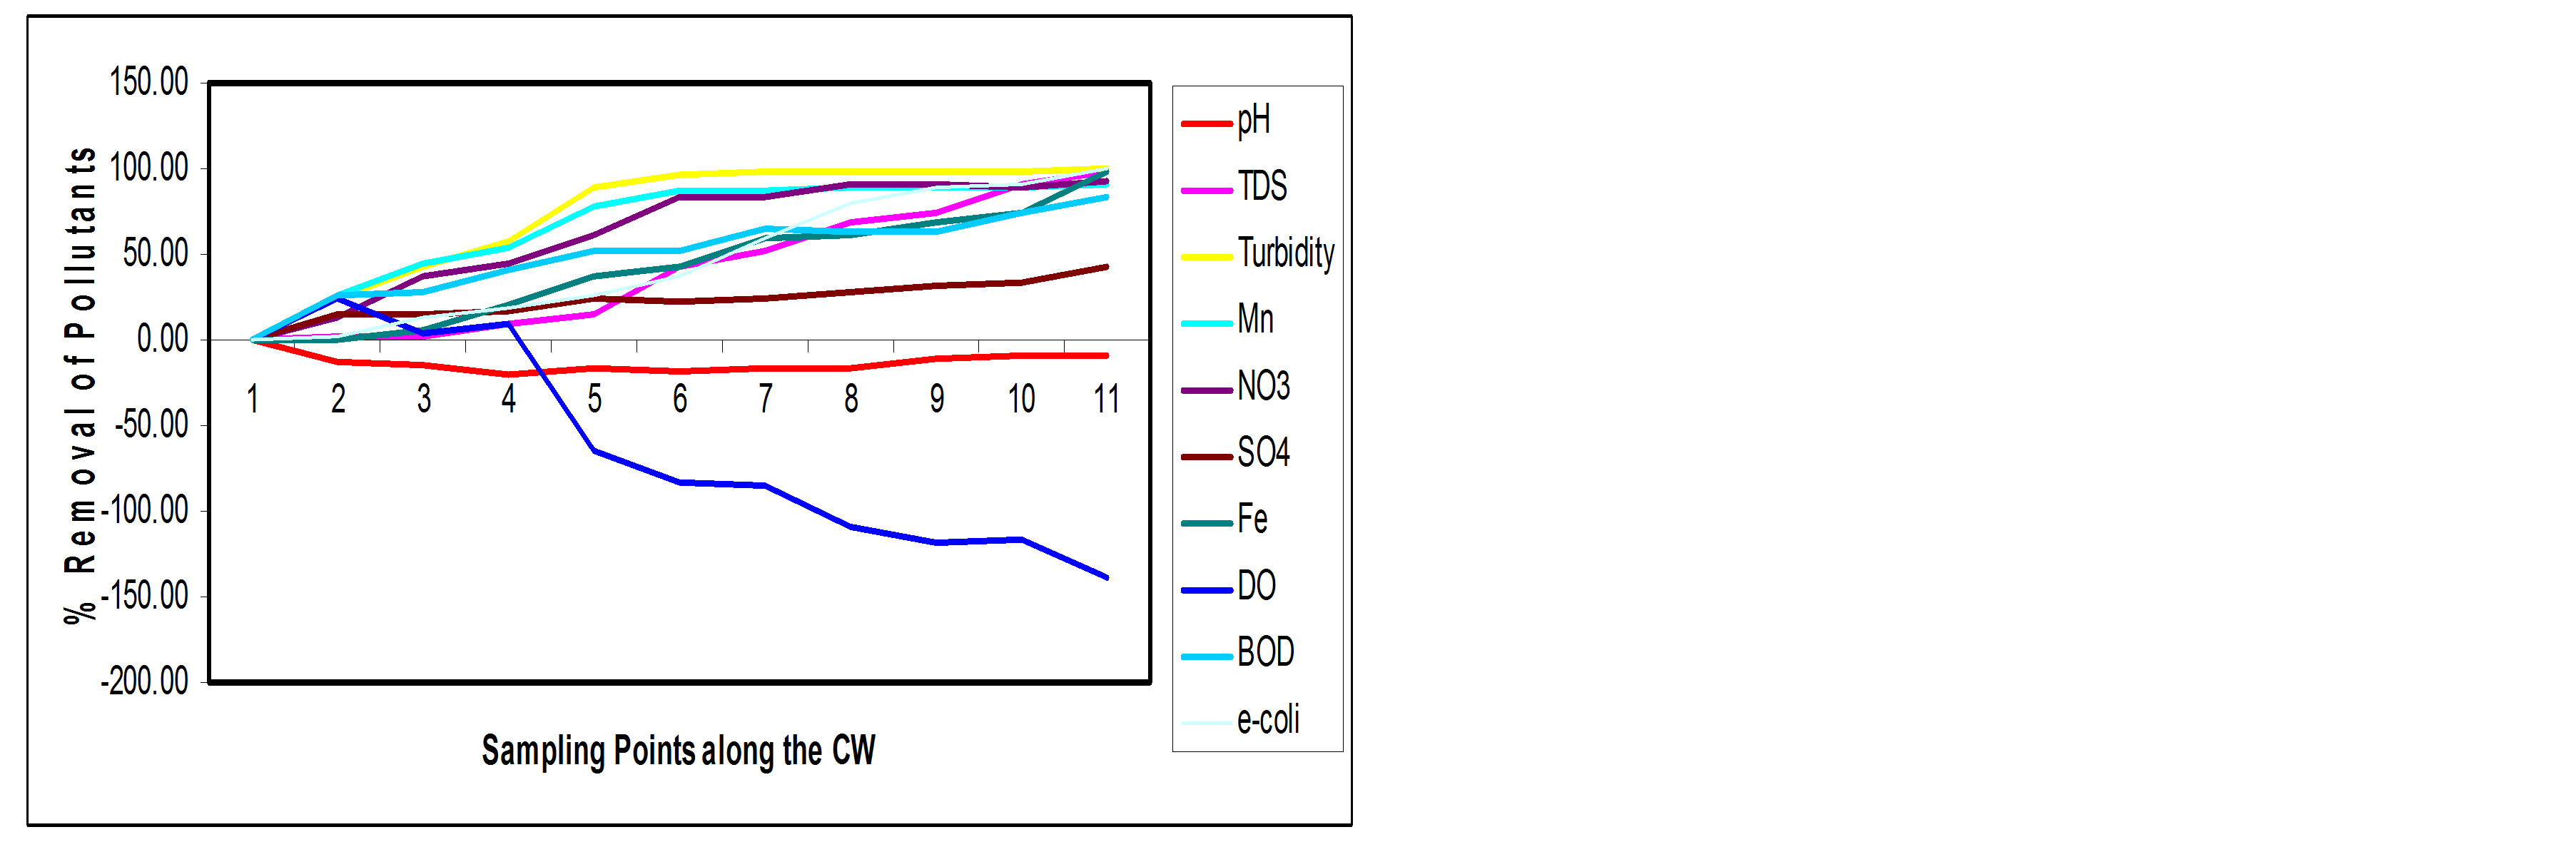
Figure 4. % Reduction of pollutants at sampling points along the SSFCW.
 (a)
(a) (b)
(b)
Figure 5. (a) pH values at sampling points of the SSFCW; (b) % Removal of pH at sampling points of the SSFCW.
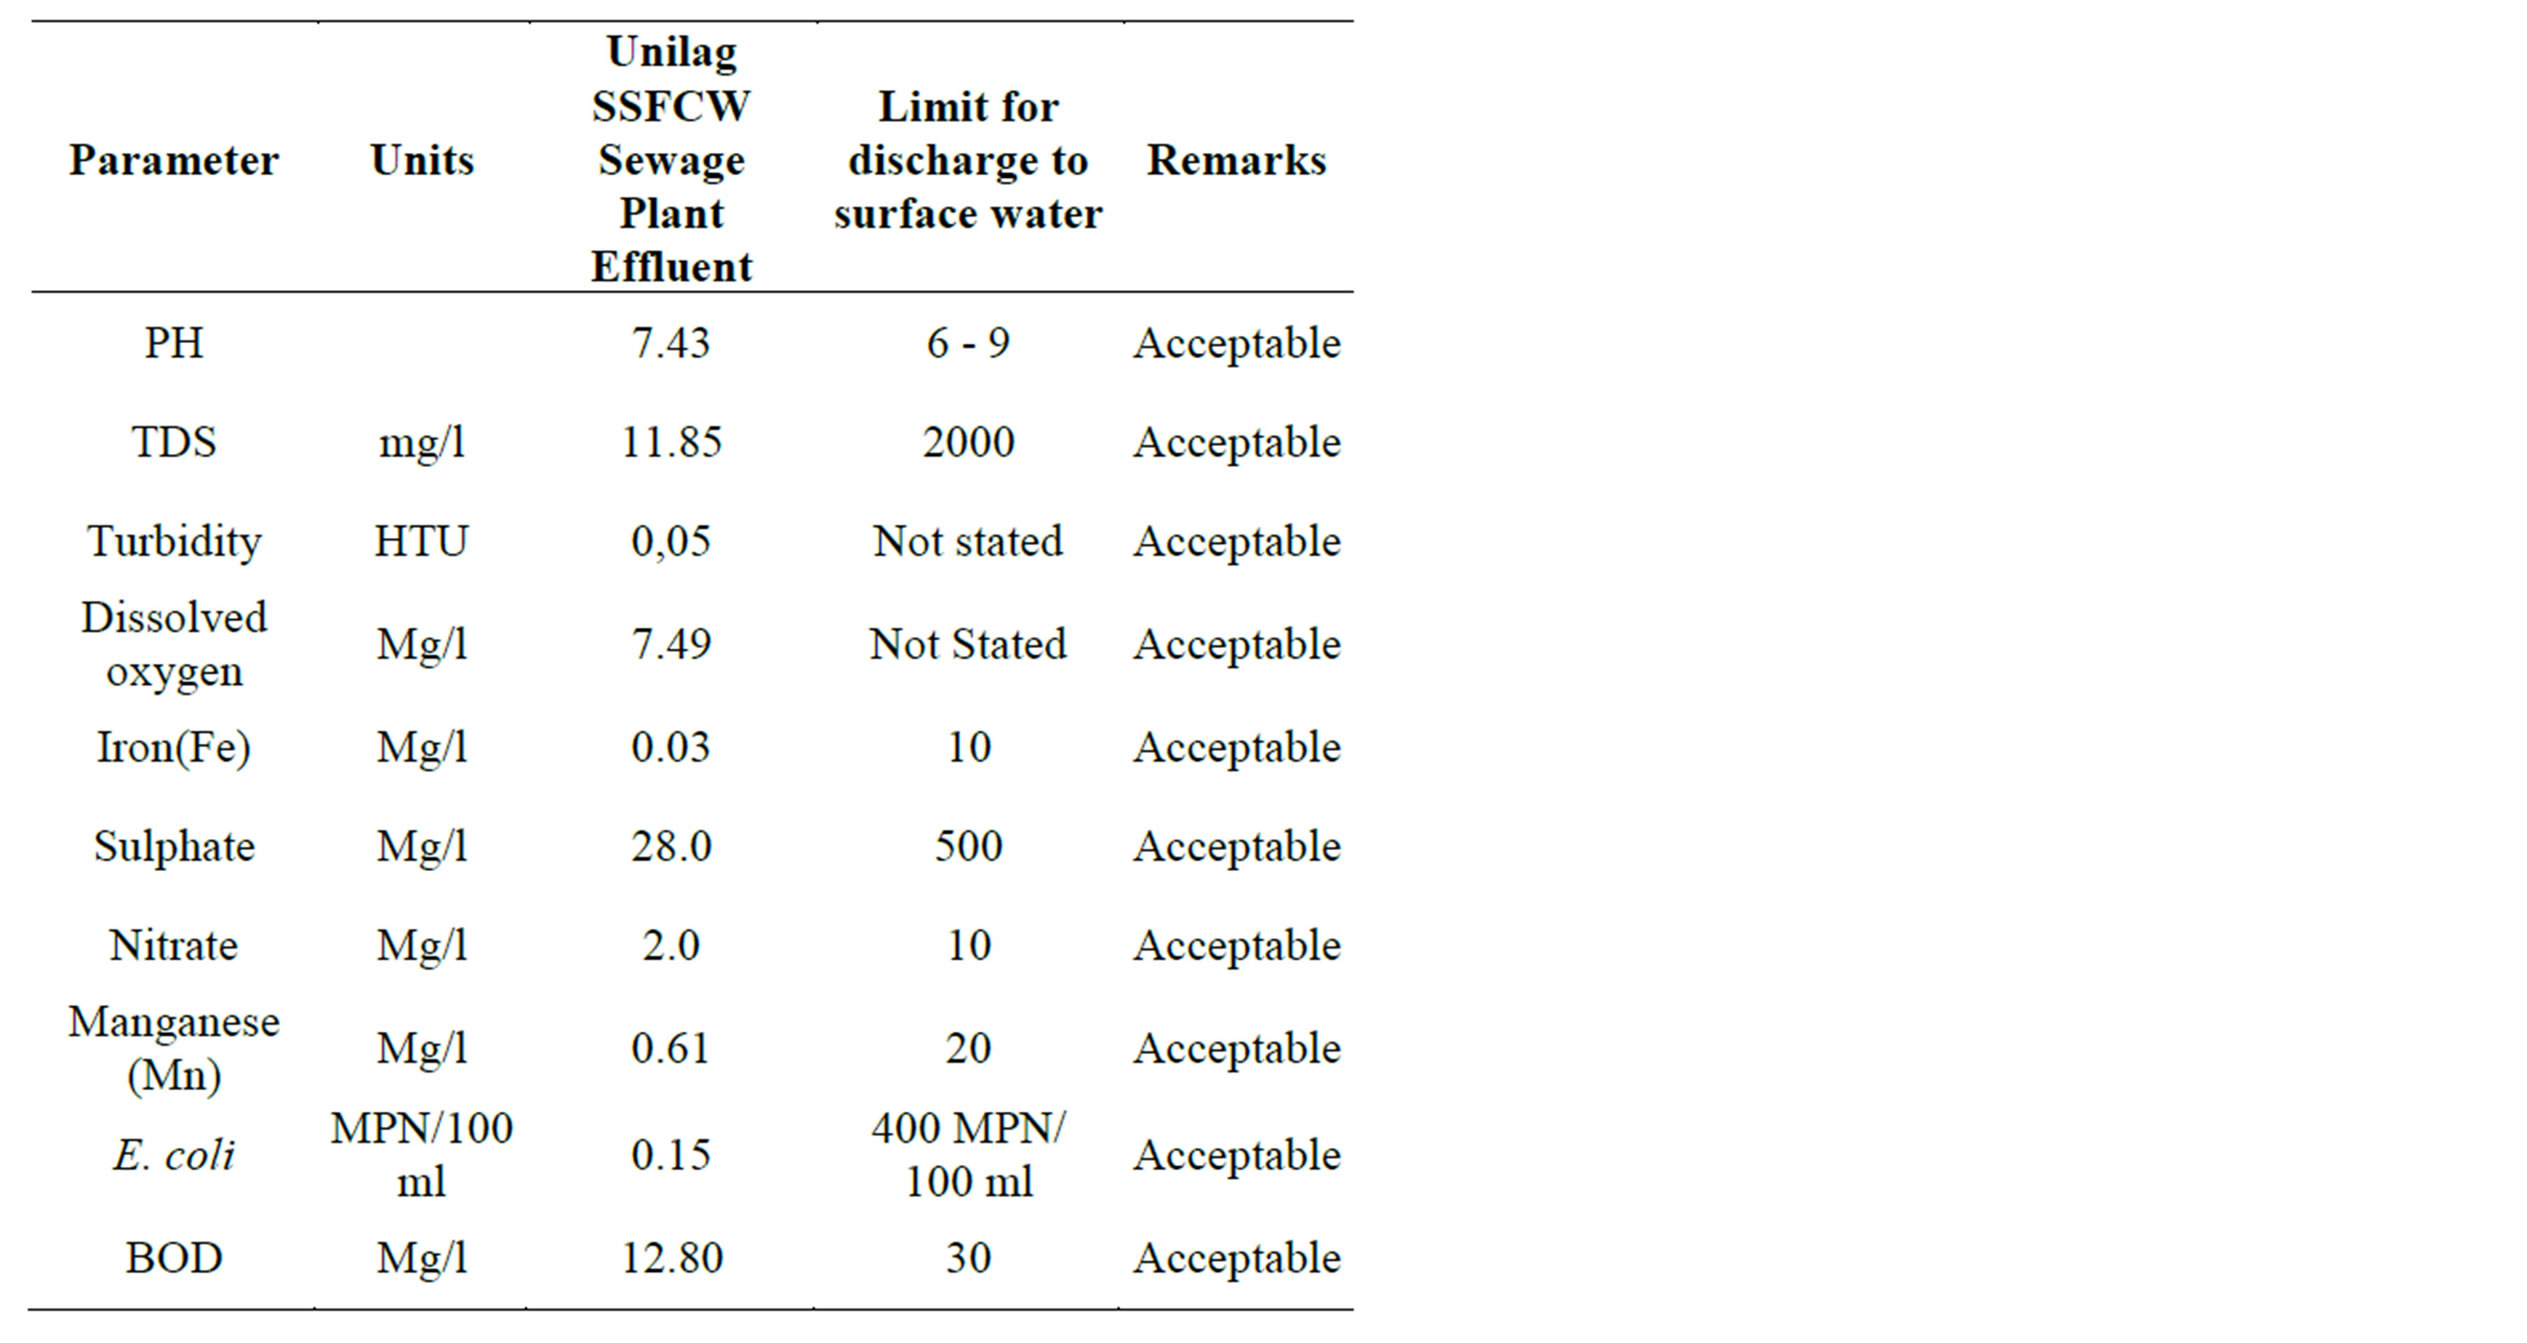
Table 3. Effluent Physical, chemical and Microbiological parameters compared with the Nigerian Effluent limitation Guidelines (FEPA, 1991).
the receiving water body. Figure 5(b) shows the percentage reductions of pH along the longitudinal profile of the SSFCW are increasingly negative.
This observation implies that the treatment process of the SSFCW improves the acidity of the sewage from slightly acidic level to an acceptable slightly above neutral level.
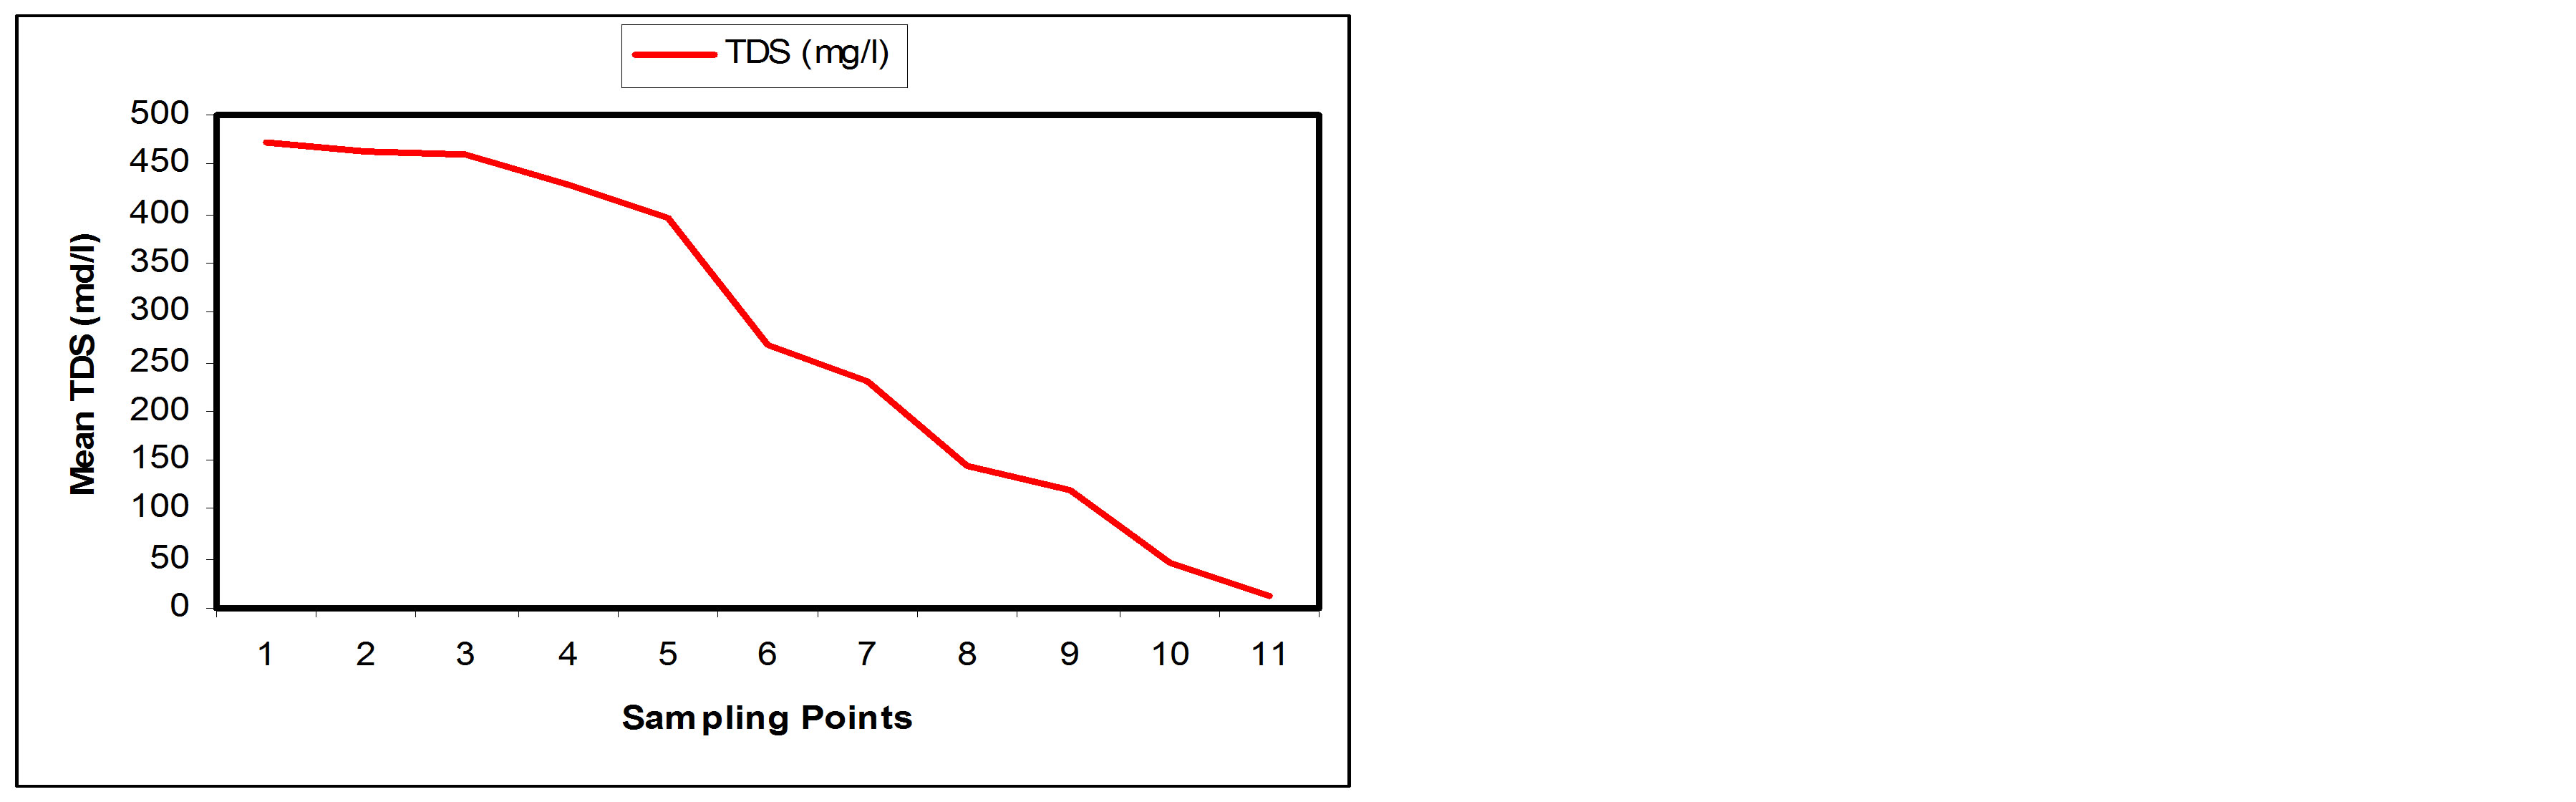
3.2.2. Total Dissolved Oxygen (TDS)
From Table 1 the TDS value of the influent was 471 mg/l while that of effluent was 11.85 mg/l. The reduction of the pollutants varied increasingly from SP1 to SP11.
A final percentage of about 97.48% was achieved at the effluent point (Table 2). It is also observed from Table 2 that more 50% of the TDS has been removed between SP1 and SP7. The result is consistent with results obtained by [13,16]. Figures 6(a) and (b) show the TDS removal performance and the percentage removal at the sampling points along the longitudinal profile of the SSFCW respectively.
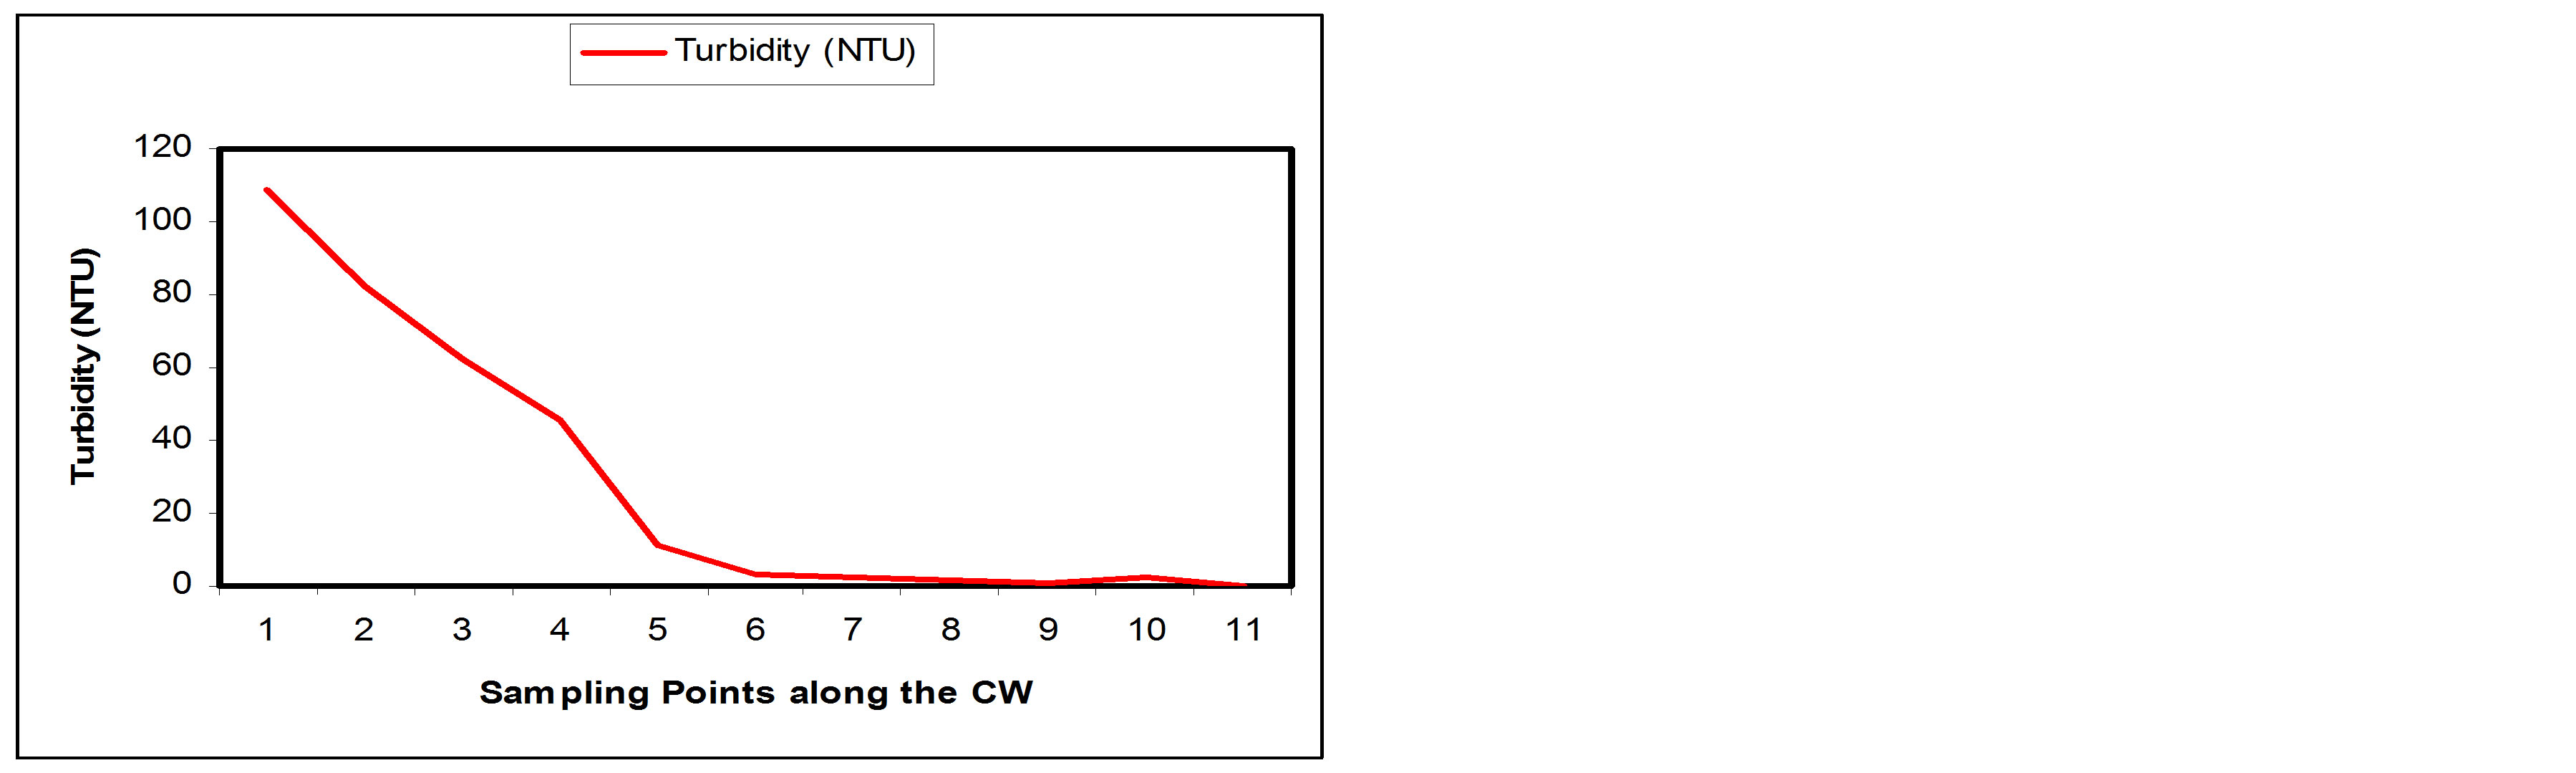
3.2.3. Turbidity
From Table 1, the turbidity value of the influent (SP1) was 108.75HTU while the effluent (SP2) had a turbidity value of 1.98HTU. Table 2 shows that the constructed wetland removed about 99.95% of the turbidity. It is also observed from Table 2 that more 50% of the Turbidity has been removed at sampling point 4. The significant decrease in turbidity can be attributed to the fact that there is a decrease in Total dissolved and suspended solids. Efficiency of constructed wetland in the removal of turbidity may depend on the sand granules, soil particle sizes and depth of the bed [14]. Figures 7(a) and (b) show the Turbidity removal performance and the % removal at the sampling points along the longitudinal profile of the SSFCW respectively.
3.3. Performance of Chemical Pollutant Parameters
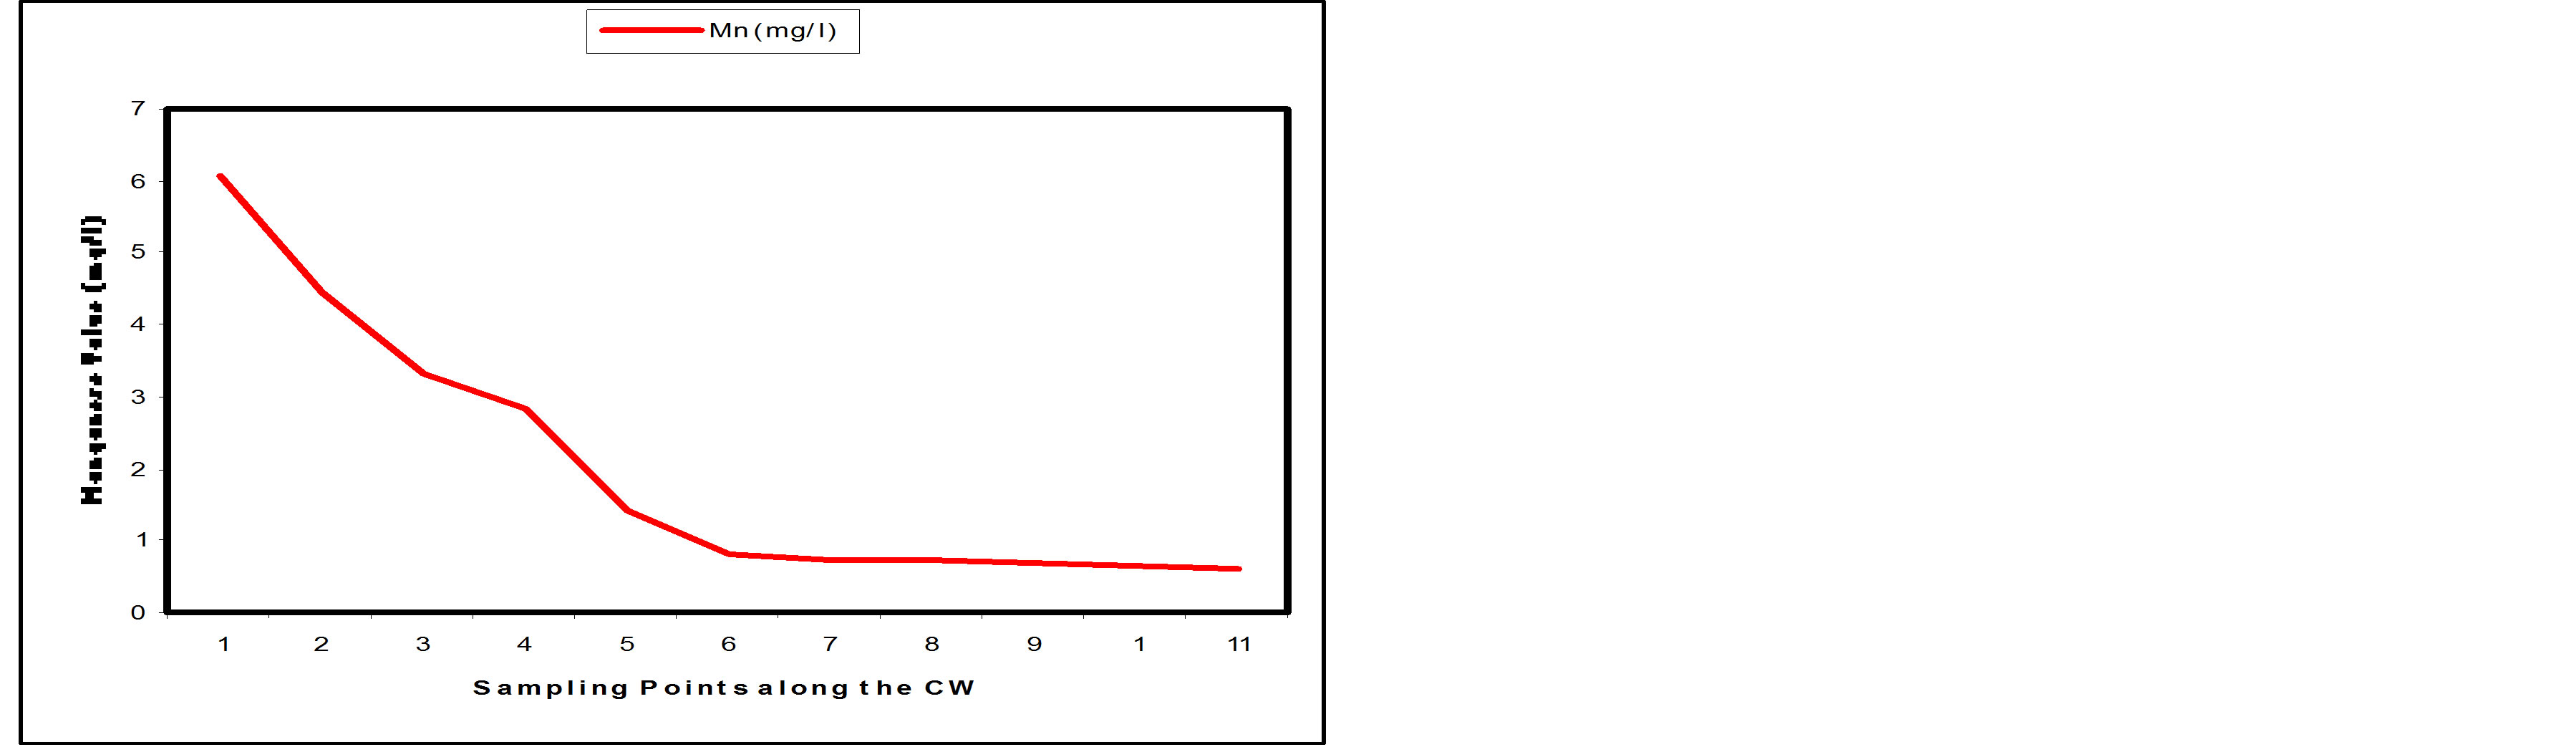
3.3.1. Manganese
A gradual decrease was observed in Manganese content of the wastewater along the SSFCW from influent level of 6.05 mg/l to effluent 0.61 mg/l (Table 1). Figure 8(a) shows the removal level of Manganese at the sampling points of the SFCW while Figure 8(b) shows the percentage removal at the sampling points along the longitudinal profile of the SFCW. It was observed that more than 50% removal of Manganese has been achieved at sample point 4, while the percentage removal at effluent point (SP11) was 89.92%.
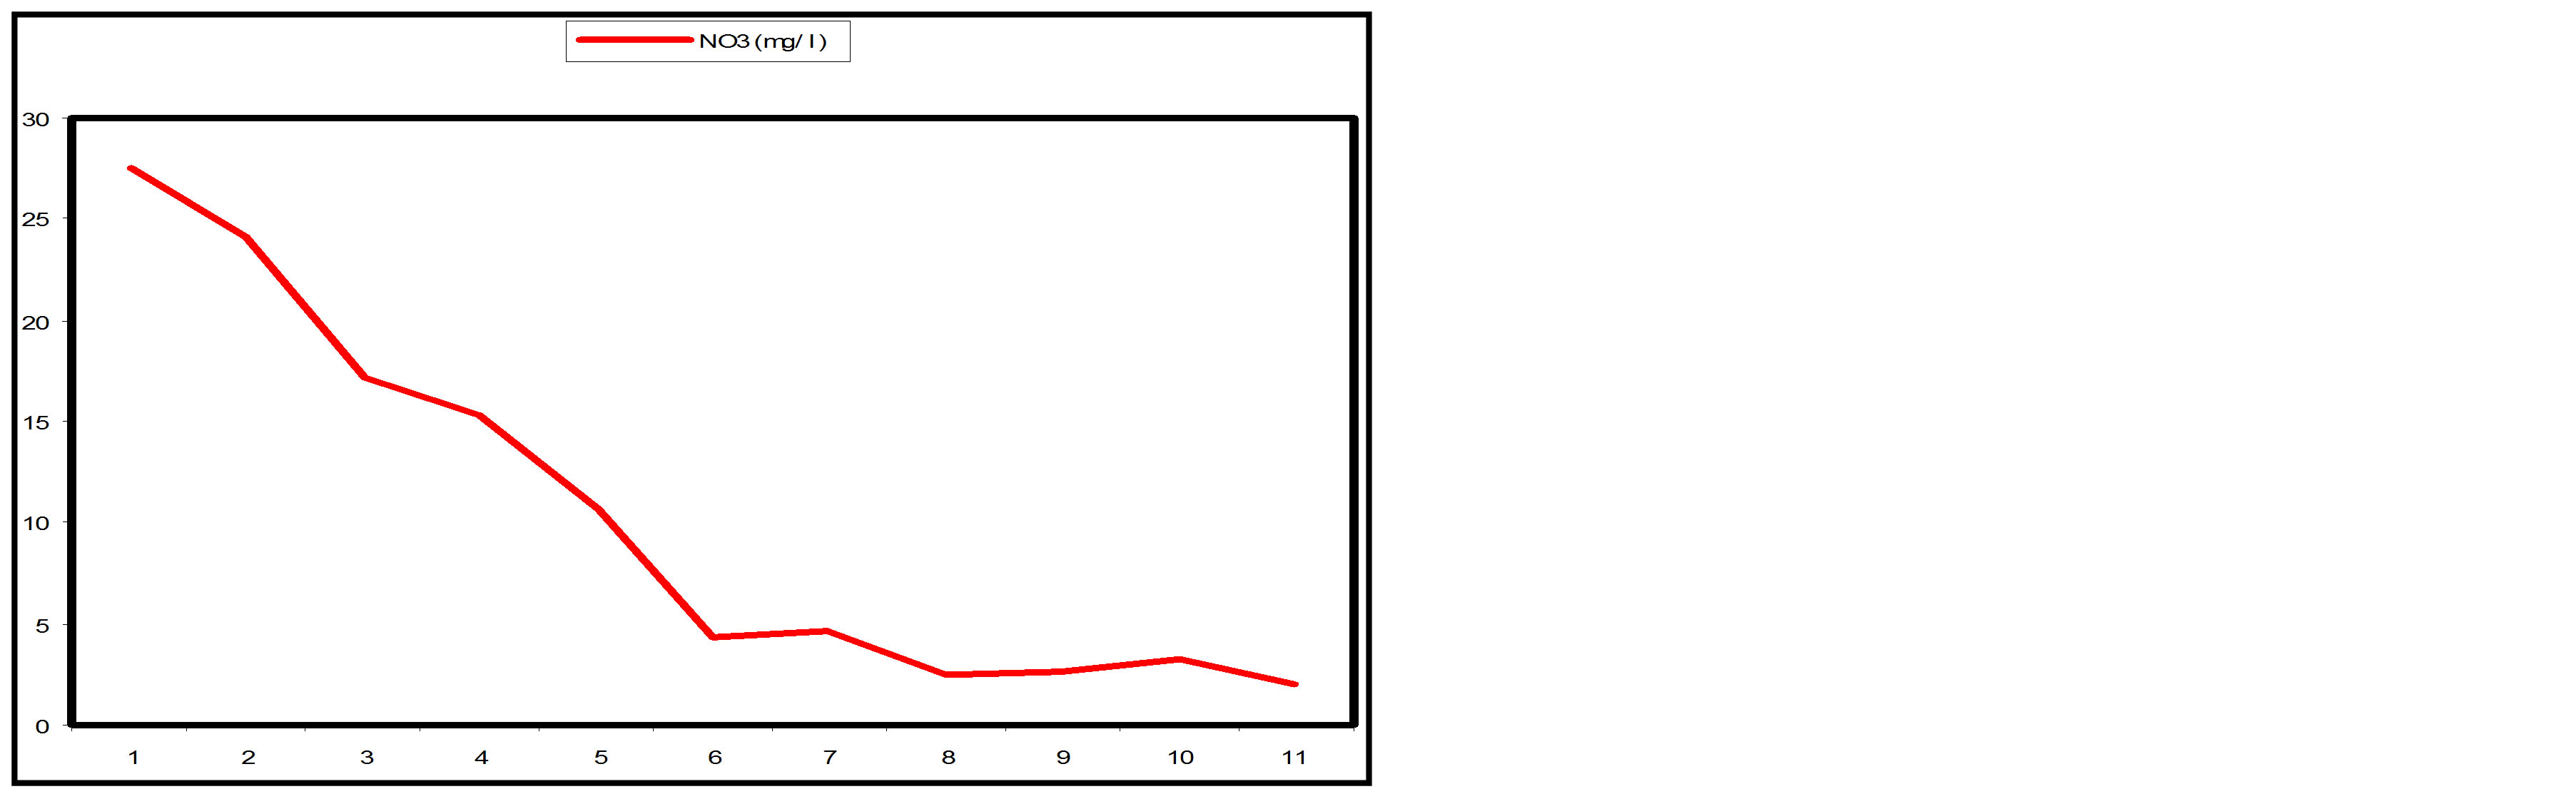
3.3.2. Nitrate
Appreciable Nitrate removal was also achieved along the SSFCW from influent 27.5 mg/l to effluent 2.0 mg/l (Table 1). Nitrate pollutant removal efficiency of 92.73% was achieved at SP11 and more than 50% of removal efficiency was achieved at SP 5 (Table 2). Figure 9(a)
 (a)
(a) (b)
(b)
Figure 6. (a) TDS values at sampling points of the SSFCW; (b) % Removal of TDS at sampling points of the SSFCW.
 (a)
(a)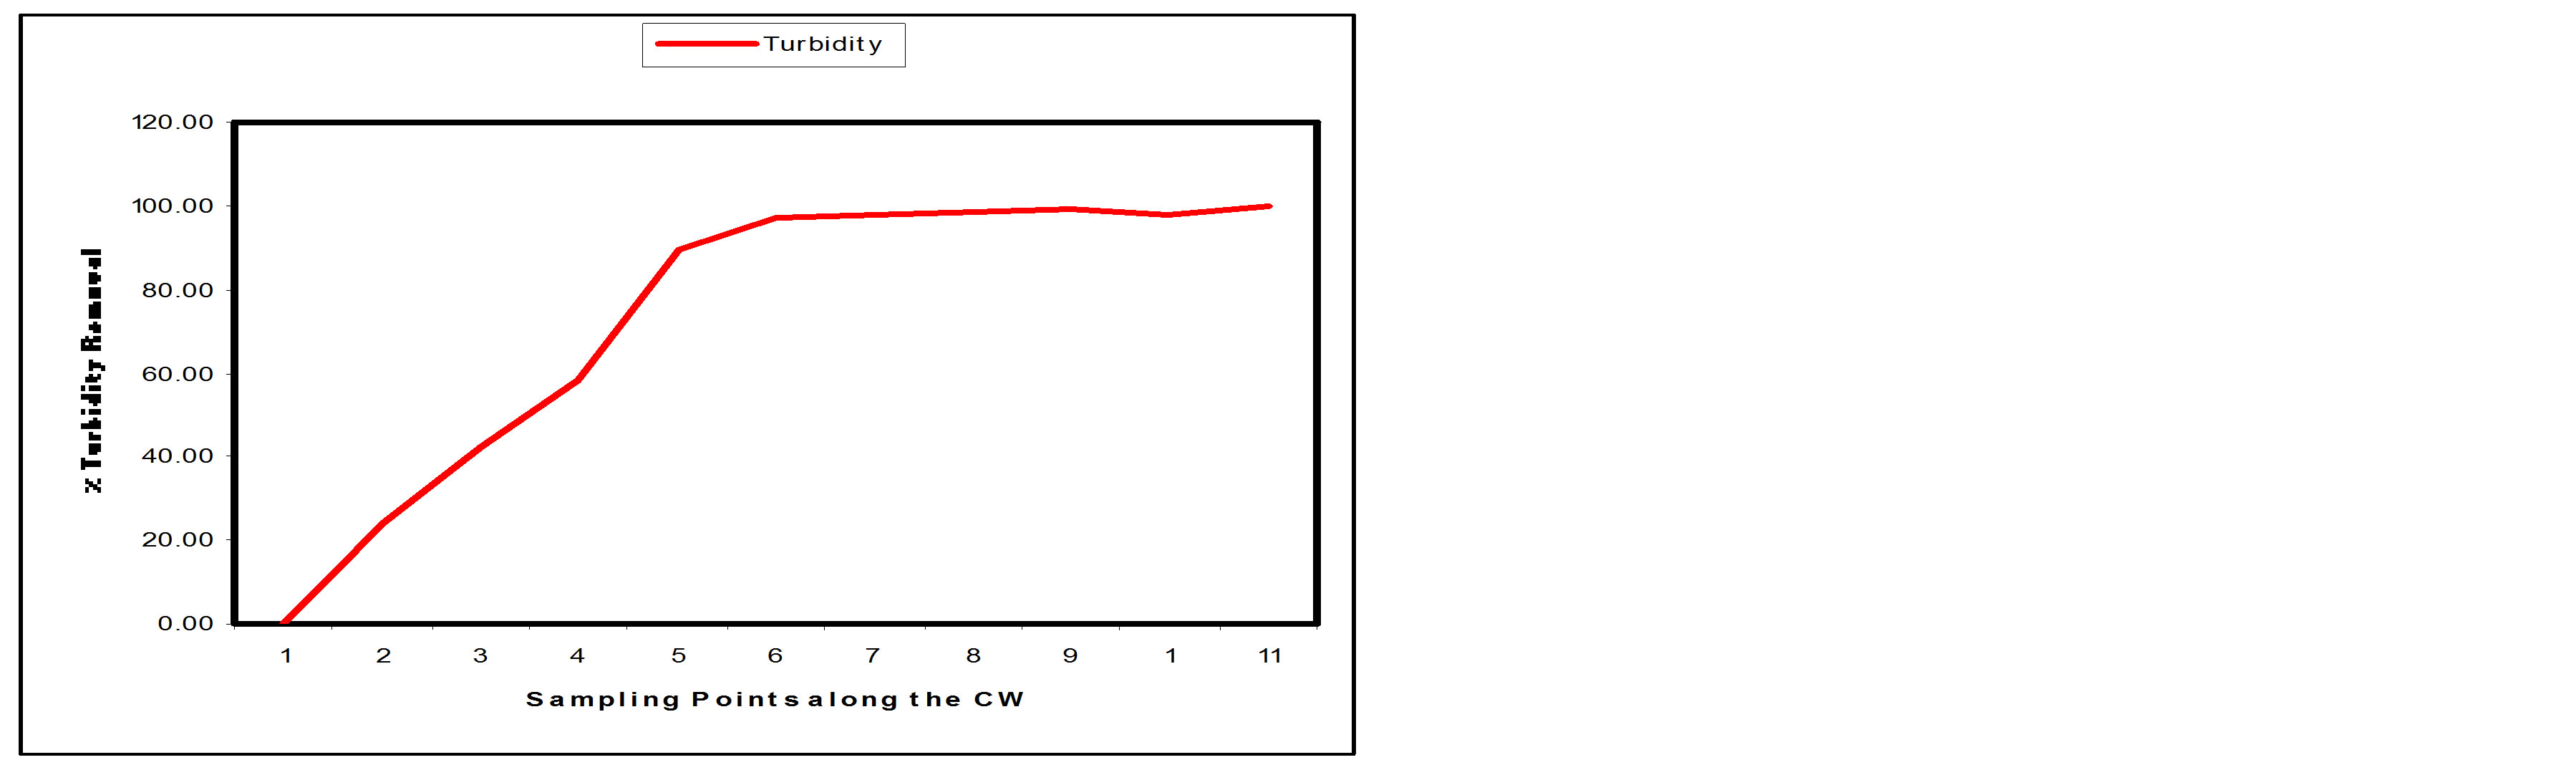 (b)
(b)
Figure 7. (a) Turbidity values at sampling points of the SFCW; (b) % turbidity removal at sampling points of the SFCW.
 (a)
(a)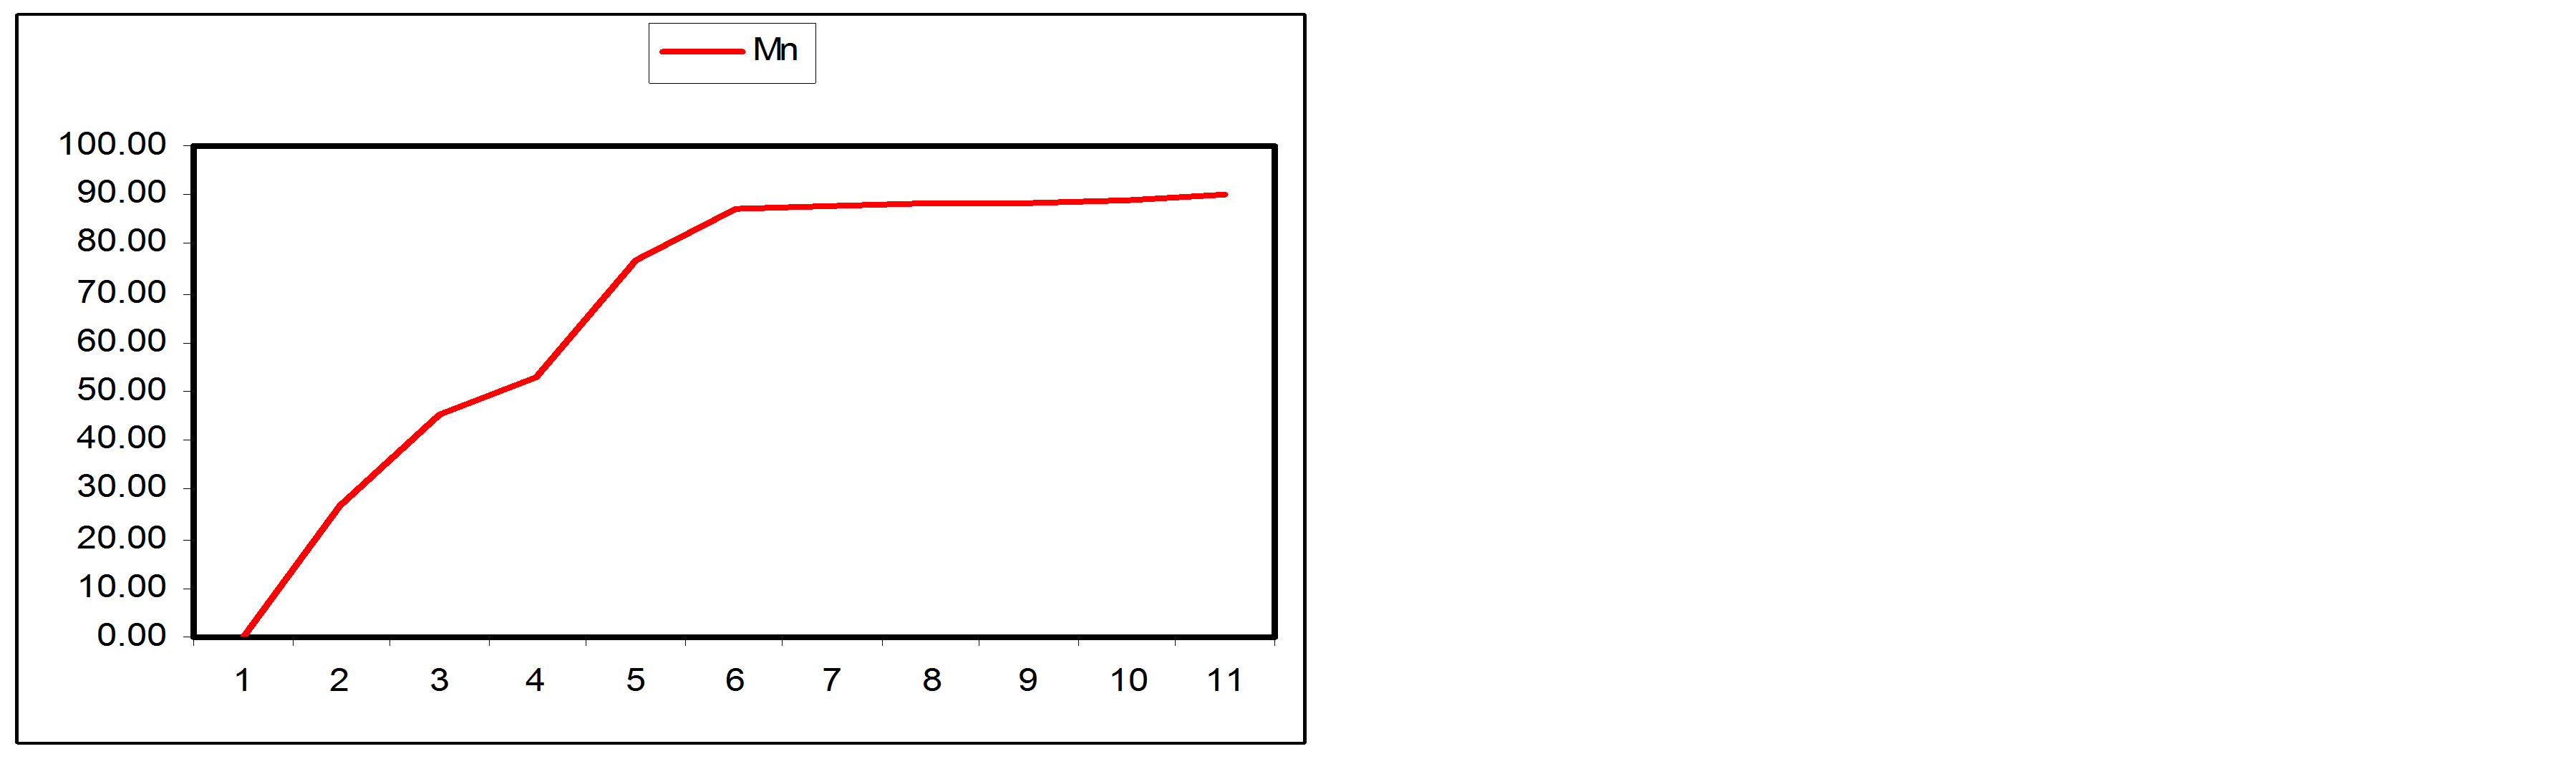 (b)
(b)
Figure 8. (a) Mn values at sampling points of the SSFCW; (b) % Mn removal at sampling points of the SSFCW.
shows the removal level of Nitrate at the sampling points of the SSFCW while Figure 9(b) shows the percentage removal of Nitrate at the sampling points along the longitudinal profile of the SSFCW. Nitrate removal in wetlands is usually very high [8]. The importance of Nitrate removal in sewage before discharging the effluent to the receiving water cannot be over emphasised. High concentration of Nitrates in drinking water can cause “blue baby” syndrome in infants [15]. High amounts of nitrogen also contribute to eutrophication in which nutrients promote excessive plant growth where plants deplete oxygen in the water [6].
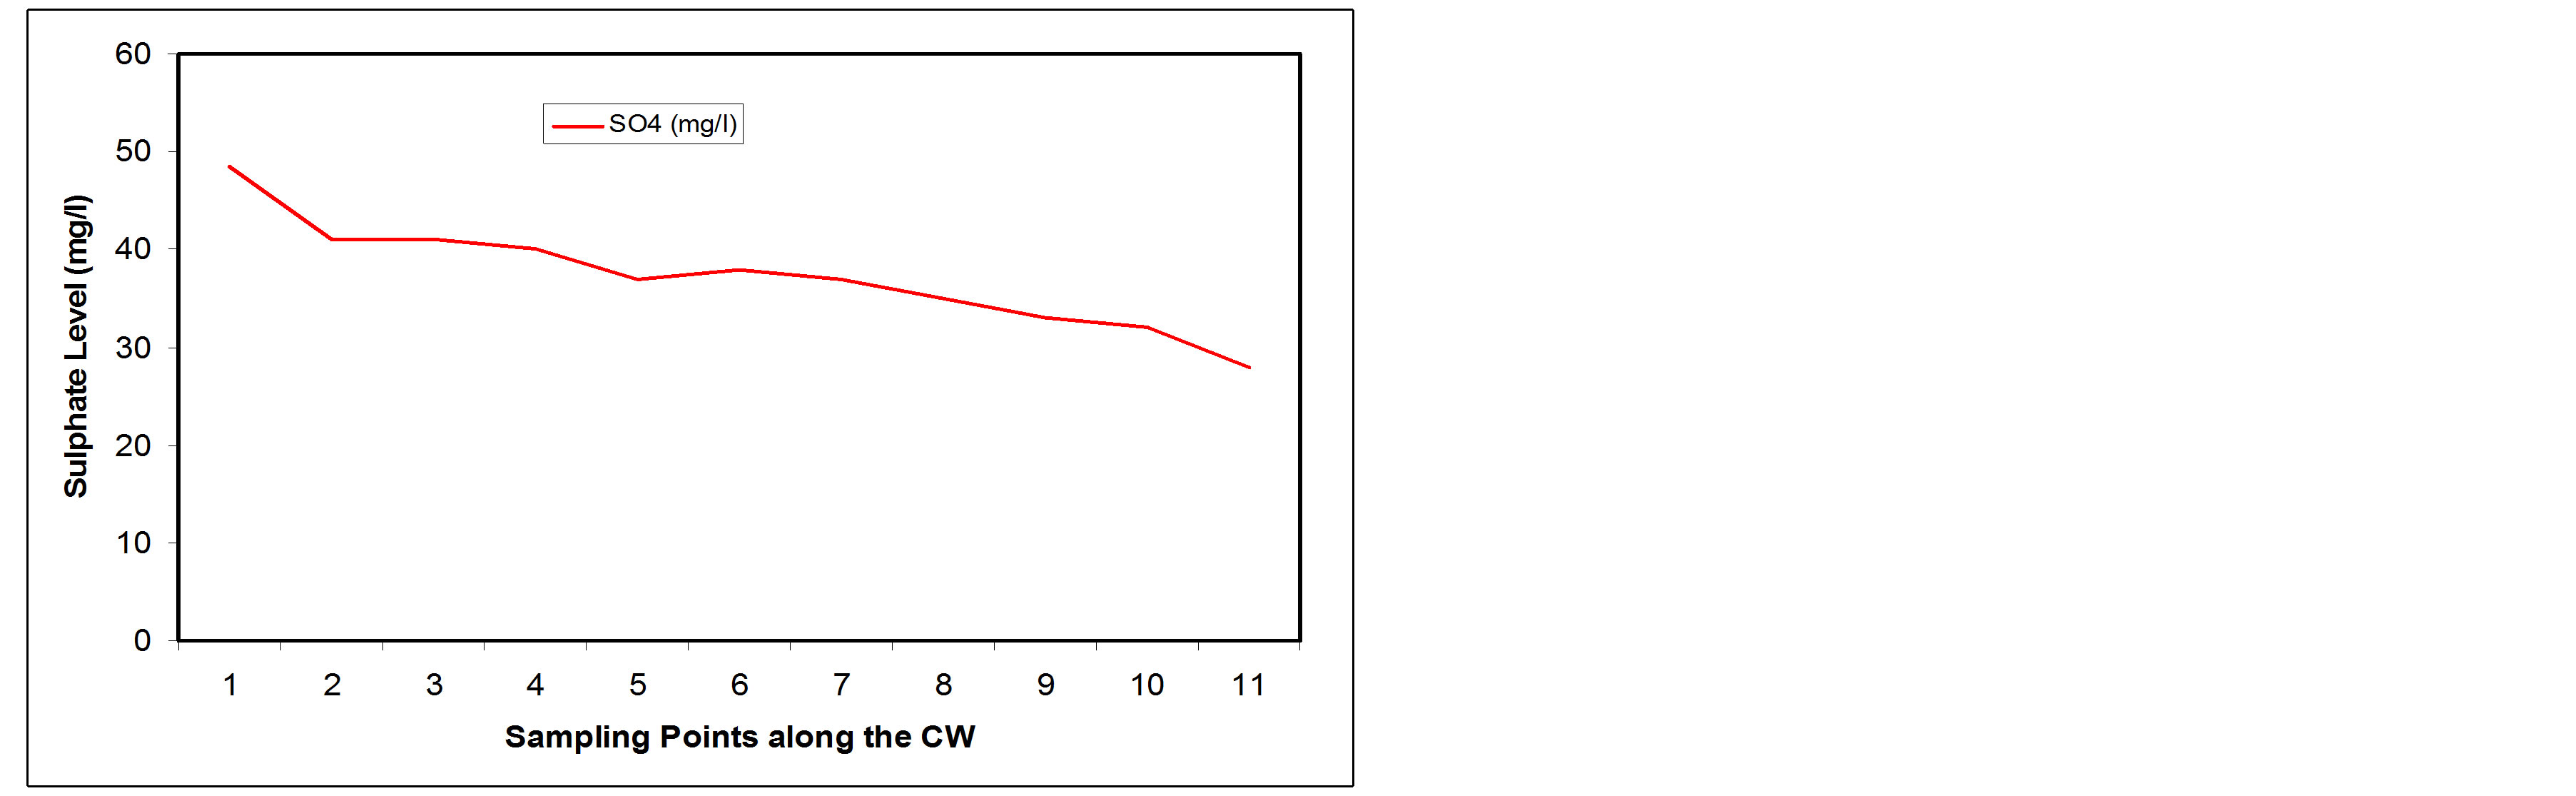
3.3.3. Sulphate
Sulphate is classified as non toxic constituent of water. However, intake of water containing high sulphate content can cause diarrhoea. The presence of sulphate in domestic wastewater may be due to the addition of detergent wastes from washing [16]. Figure 10(a) shows that the SSFCW in this study was not very efficient in removing sulphates from the wastewater. The influent wastewater had 48.5 mg/l sulphate while the effluent had 28 mg/l sulphate (Figure 10(a)), and this is a removal of only about 42.27% (Figure 10(b)). Despite the rather low removal percentage, the effluent sulphate concentration is still far less than the FEPA discharge specification of 400 mg/l.
 (a)
(a)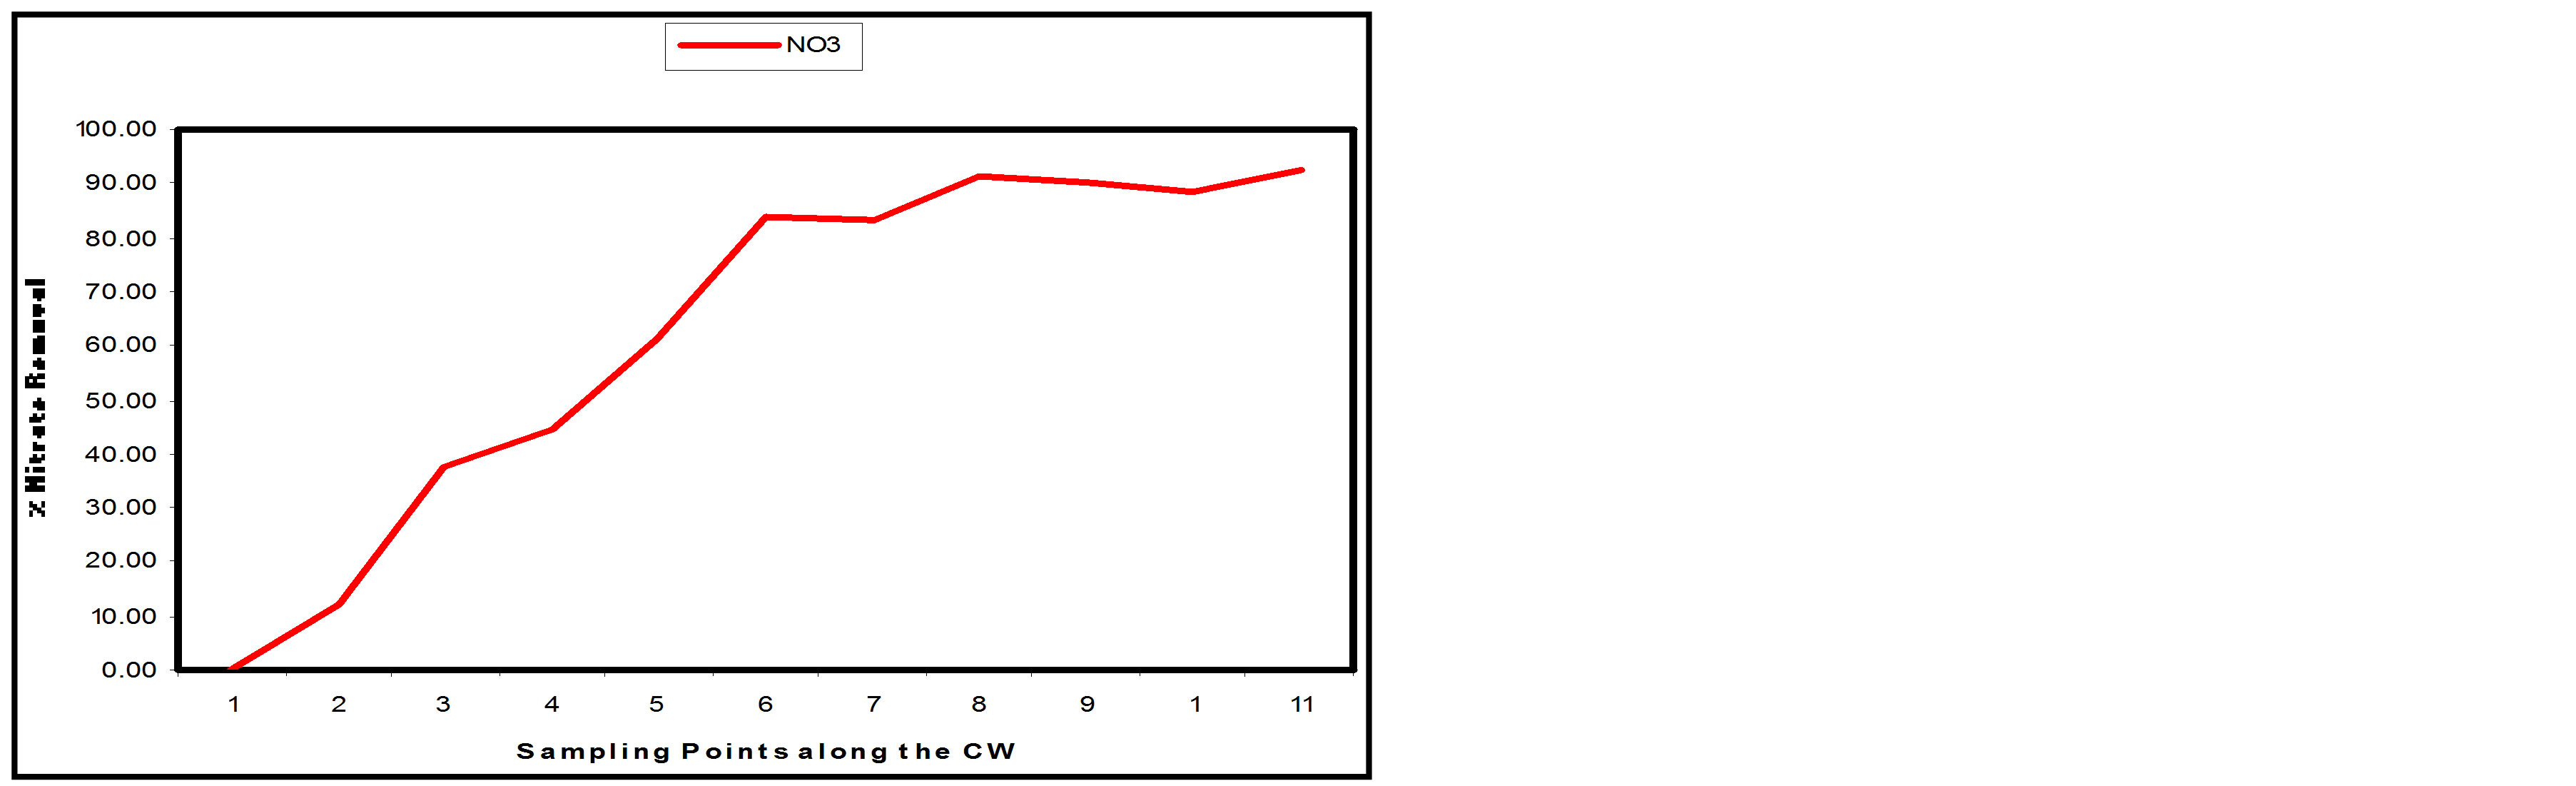 (b)
(b)
Figure 9. (a) NO3 values at sampling points of the SSFCW; (b) % NO3 removal at sampling points of the SSFCW.
 (a)
(a) (b)
(b)
Figure 10. (a) NO3 values at sampling points of the SSFCW; (b) % NO3 removal at sampling points of the SSFCW.
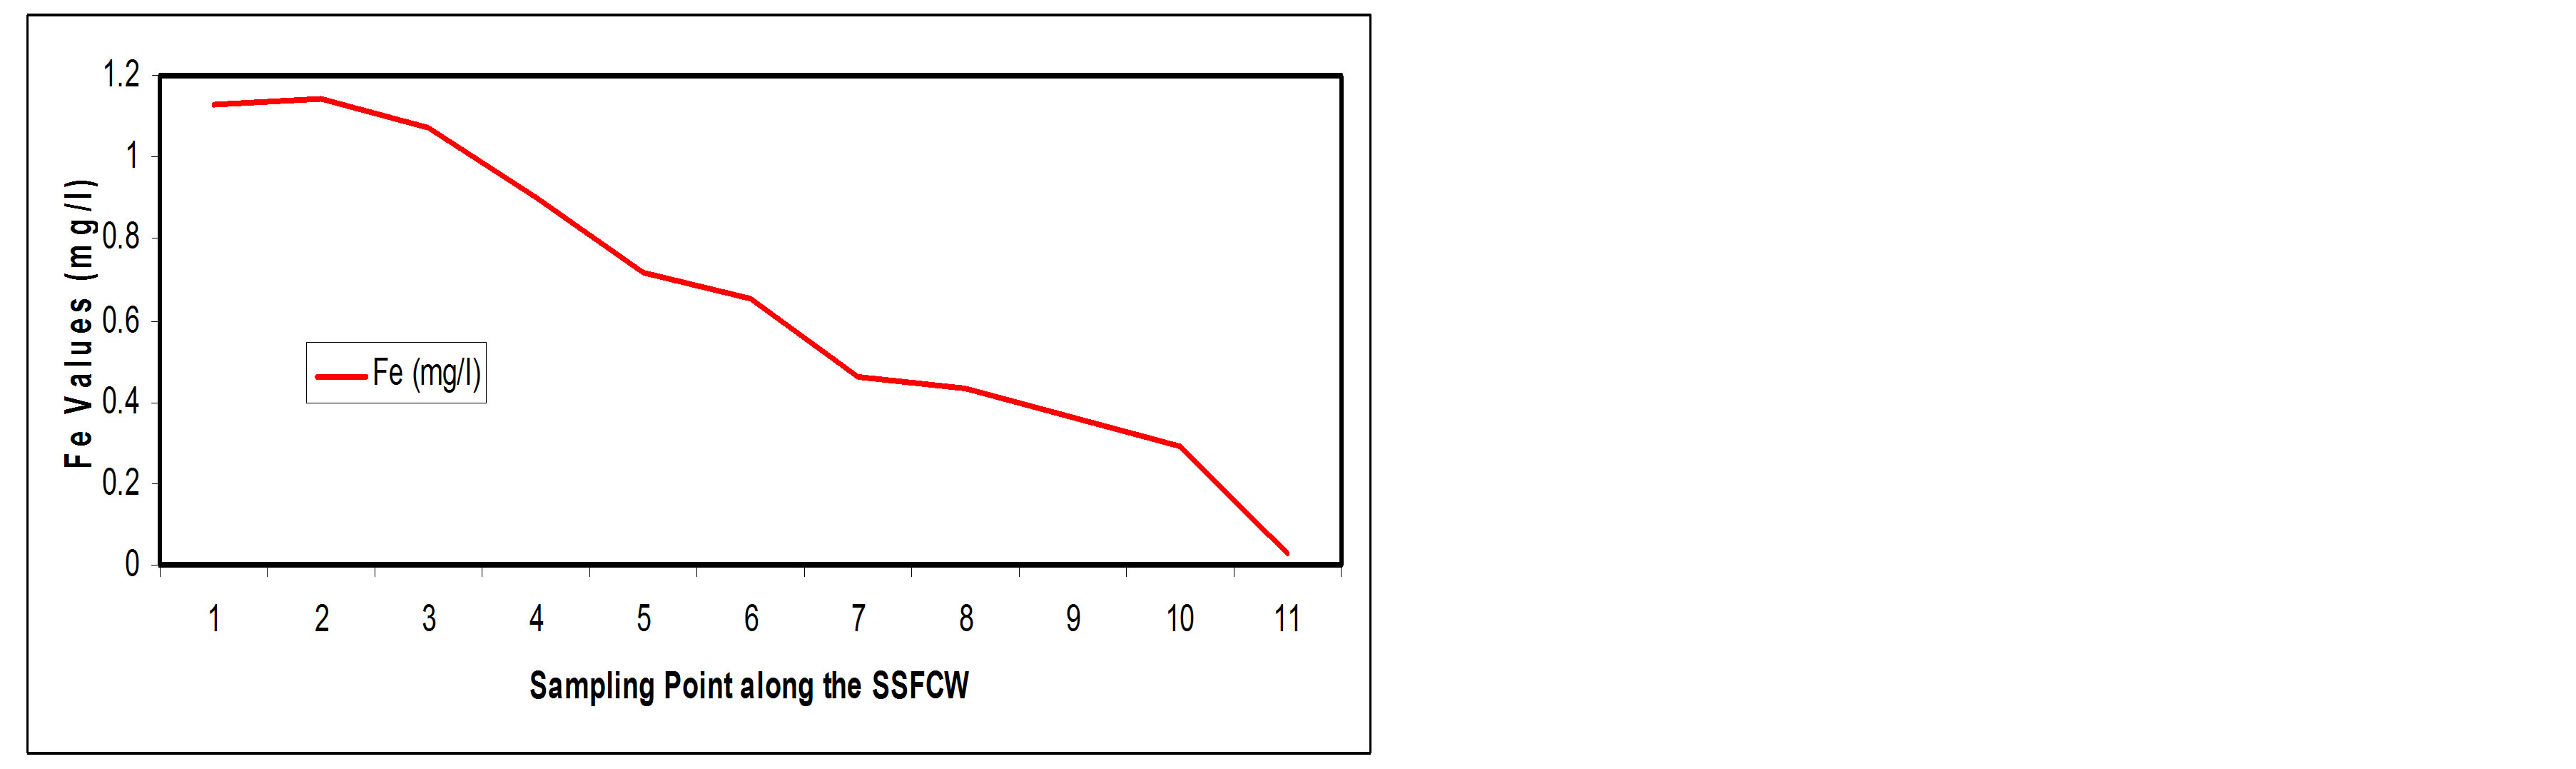
3.3.4. Iron
Figure 10(a) shows the steady reduction in the iron content of the wastewater along the SSFCW from influent from 1.13 mg/l to effluent 0.03 mg/l (Table 1 and Figure 11(a)) and an overall removal efficiency of 97.35% (Table 2 and Figure 11(b)). The effluent concentration is thus within the limit of FEPA standards.
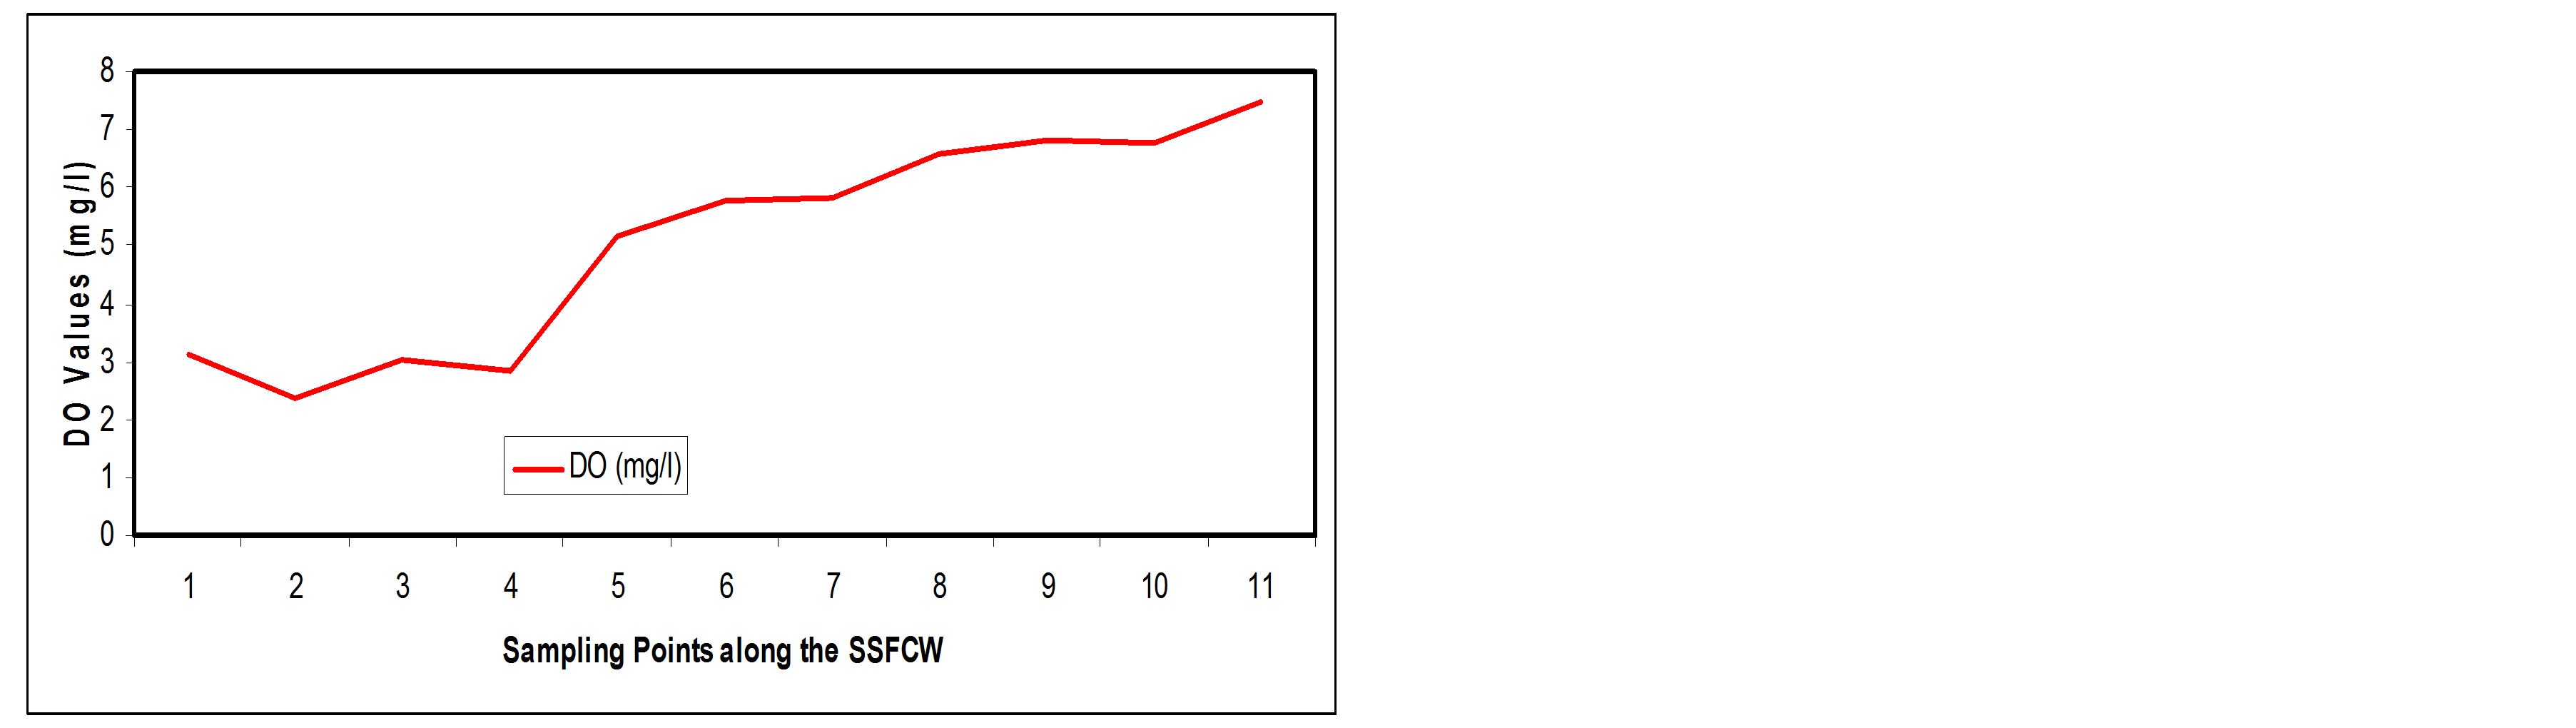
3.3.5. Dissolved Oxygen
A healthy body of water should have a dissolved oxygen of at least 5.2 mg/l [17]. Low oxygen concentration is associated with heavy organic matter contamination [14]. In this study, DO value increased along the SSFCW from influent (SP1) with a value of 3.14 mg/l to the effluent point (SP11) with a value of 7.49 mg/l (Figure 12(a)), an improvement efficiency of about 138.54% ( Figure 12(b)). The negative decline seen in the percentage curve (Figure 12(b)) signifies the fact that the DO was increasing along the sampling point.
The improvement noticed in dissolved oxygen after treatment in the constructed wetland may be due to re-duction in organic pollutants and microbial population due to their retention in the beds and simultaneous mixing of atmospheric oxygen [14]. Also, there is oxygen exchange between the roots of the plants, the microbio logical activities of the organism and the water flowing
 (a)
(a) (b)
(b)
Figure 11. (a) Fe values at sampling points of the SSFCW; (b) % Fe removal at sampling points of the SSFCW.
 (a)
(a)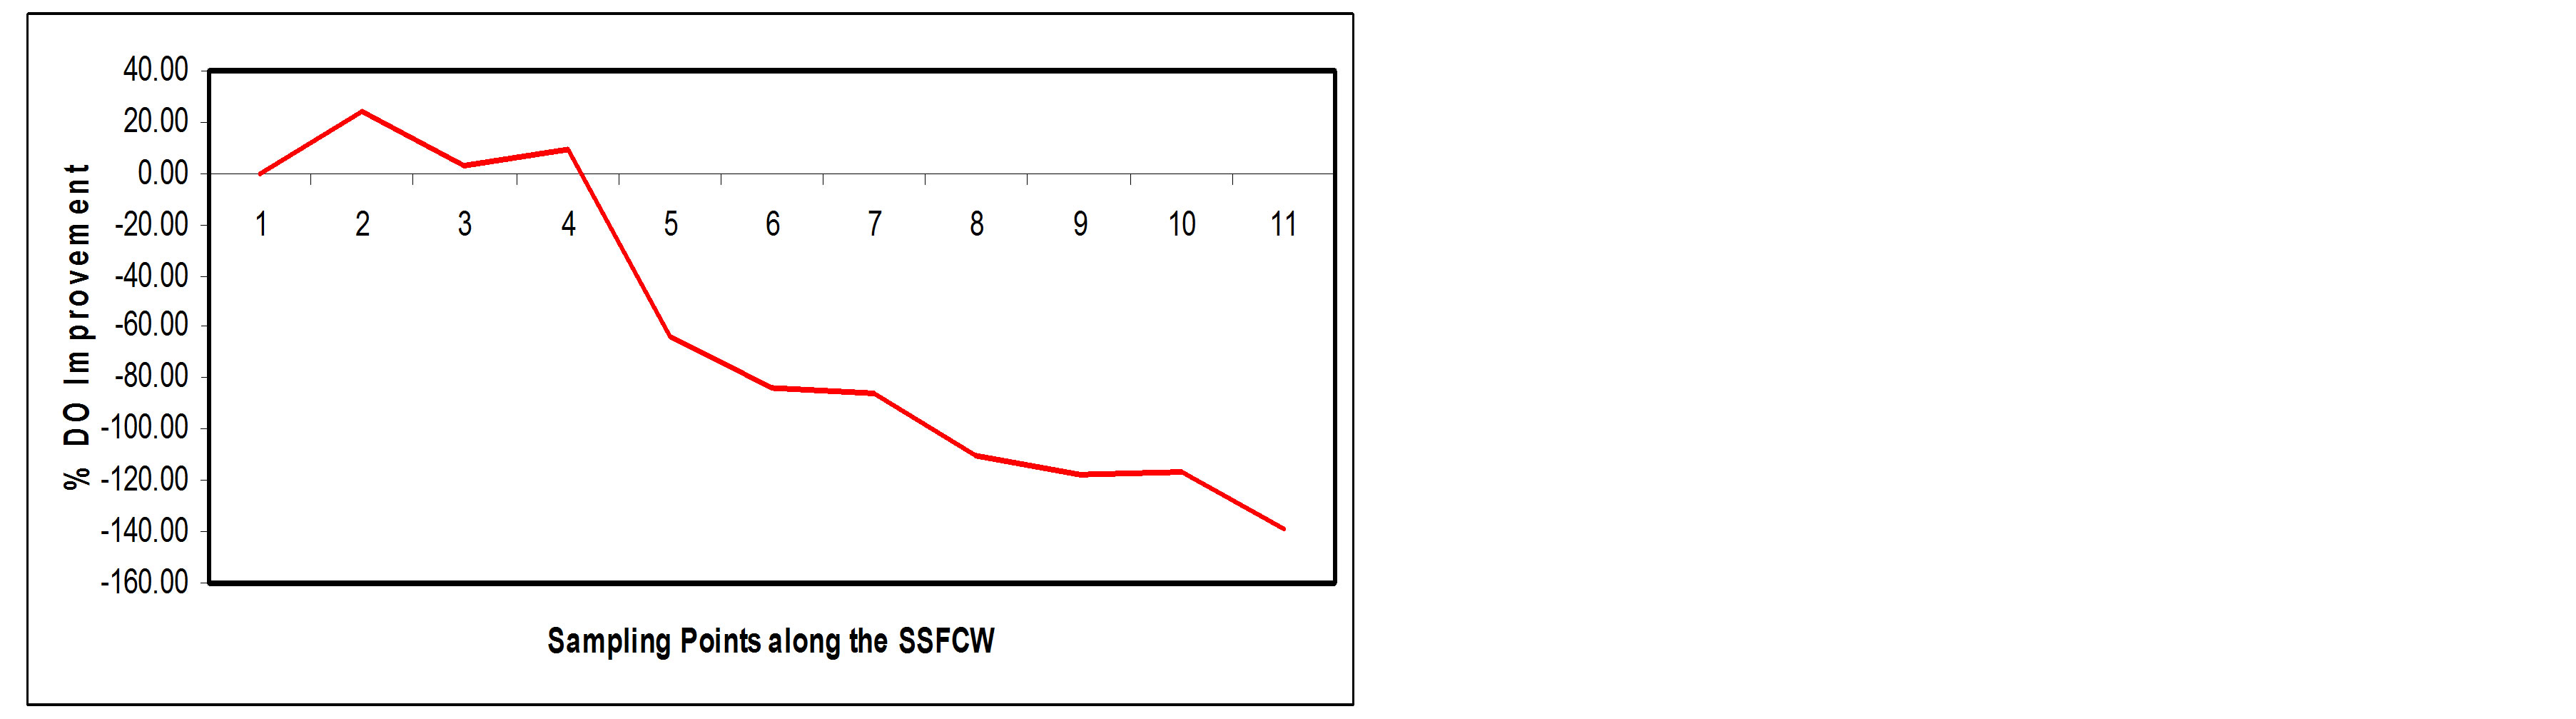 (b)
(b)
Figure 12. (a) Fe values at sampling points of the SSFCW; (b) % Fe removal at sampling points of the SSFCW.
in the constructed wetland [18].
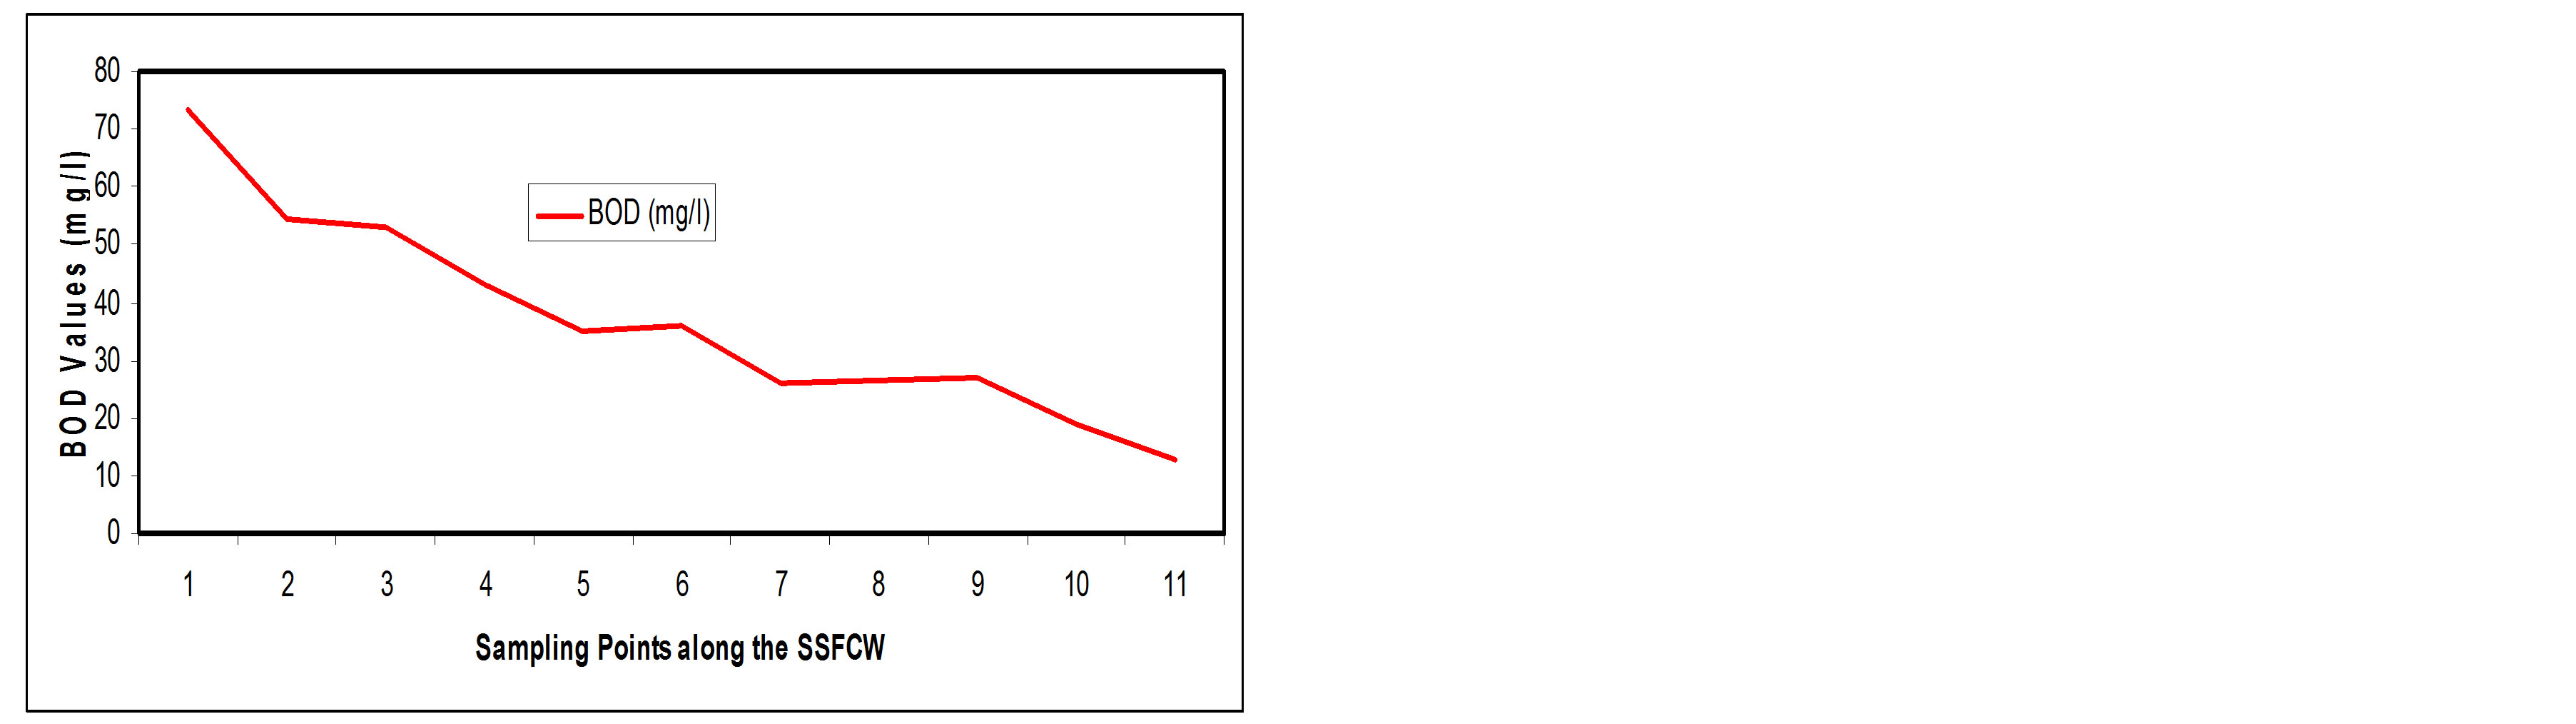
3.3.6. Biochemical Oxygen Demand (BOD)
Biochemical oxygen demand is used to measure how much oxygen microorganisms are consuming to break down organics.
There should be enough oxygen in the water of the wetland to ensure survival of plants and animals [8]. In the current study, BOD values in the SSFCW decreased from 73.14 mg/l at influent point (SP1) to a value of (12.80 mg/l) at effluent point (SP11) i.e. about 82.47% removal efficiency (Figures 13(a) and (b)).
Constructed wetlands are known to be highly efficient in reduction of BOD [6,13,14,19]. The physical removal of BOD5 occurs rapidly through settling and entrapment of particulate matter in the void spaces in the gravel or rock media. Soluble BOD5 is removed by the microbial growth on the media surfaces and attached to the plant roots and rhizomes penetrating the bed. In constructed wetland system, a fraction of BOD5 is produced within the system due to the composition of plant litter and other naturally occurring organic materials, thus making it impossible to achieve complete BOD5 removal and a residual BOD5 is typical present in the effluent [20].
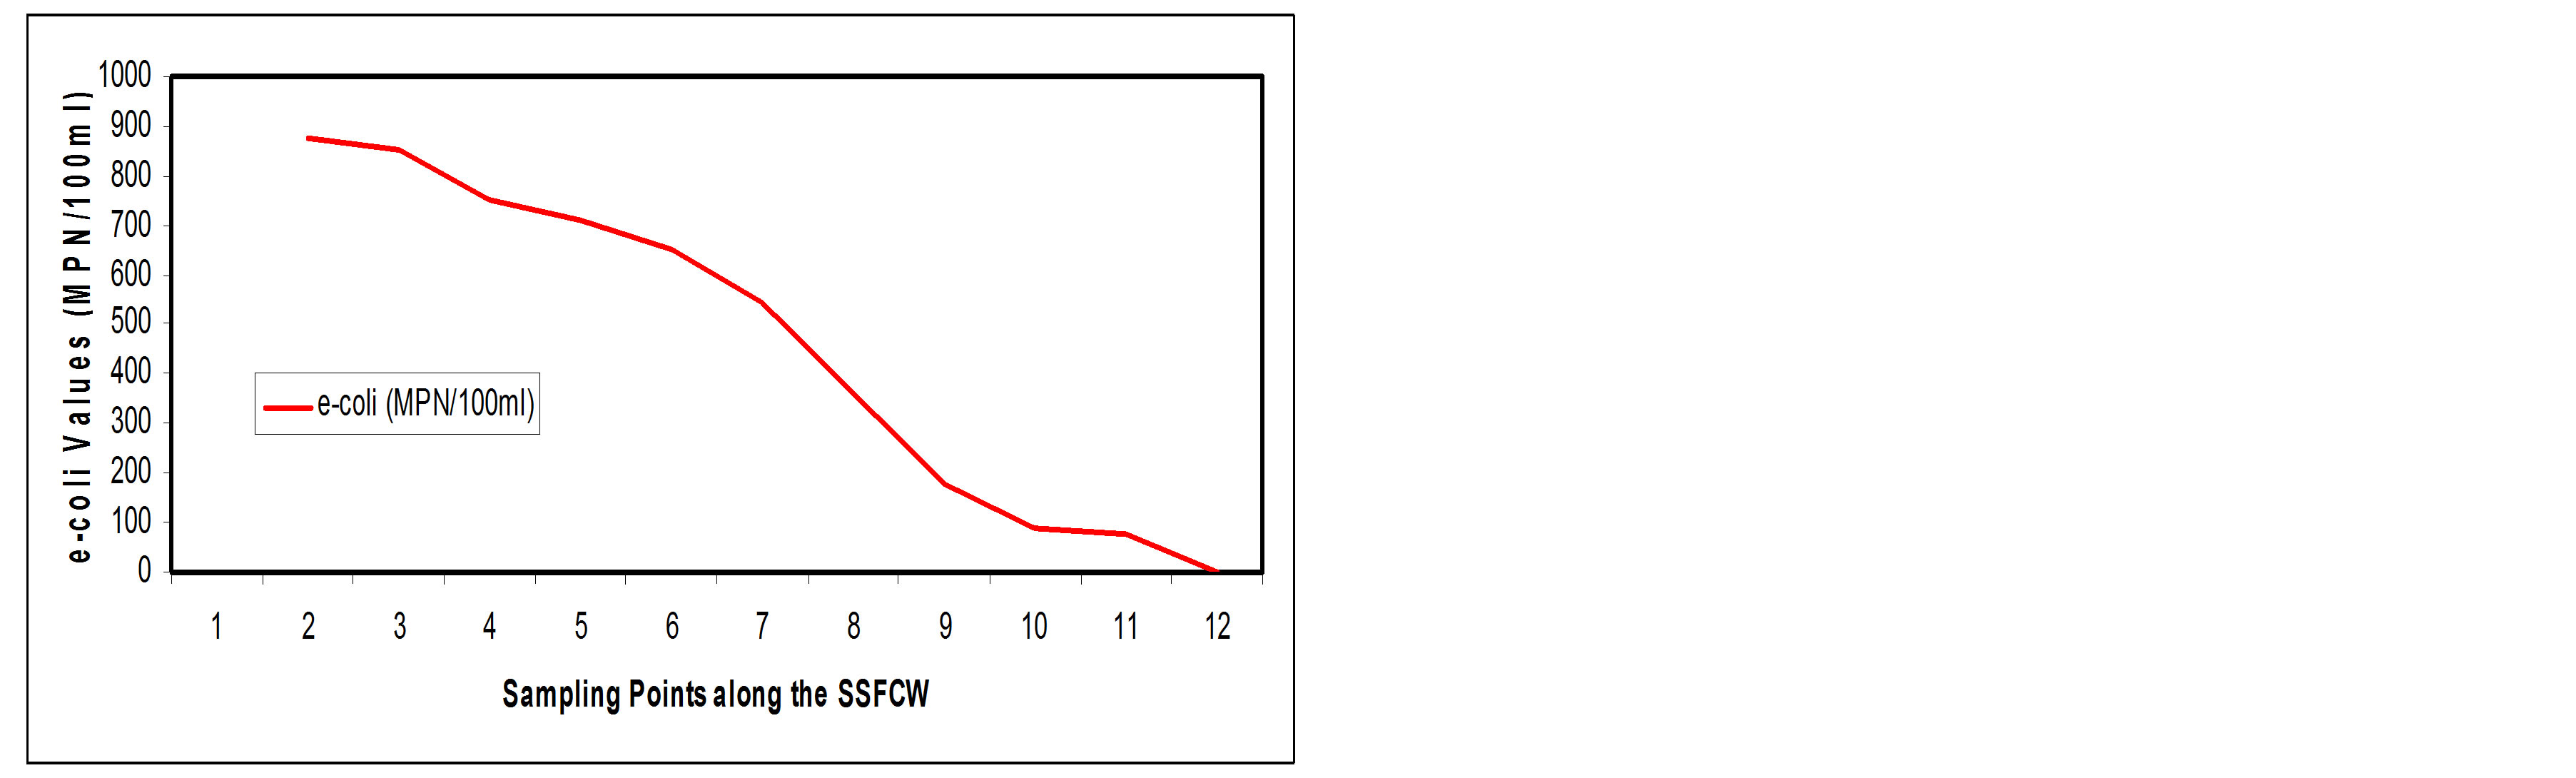
3.4. Performance of Microbiology Pollutants Parameters
Escherichia coli (E-coli)
A measure of the microbiology quality of sewage is
 (a)
(a)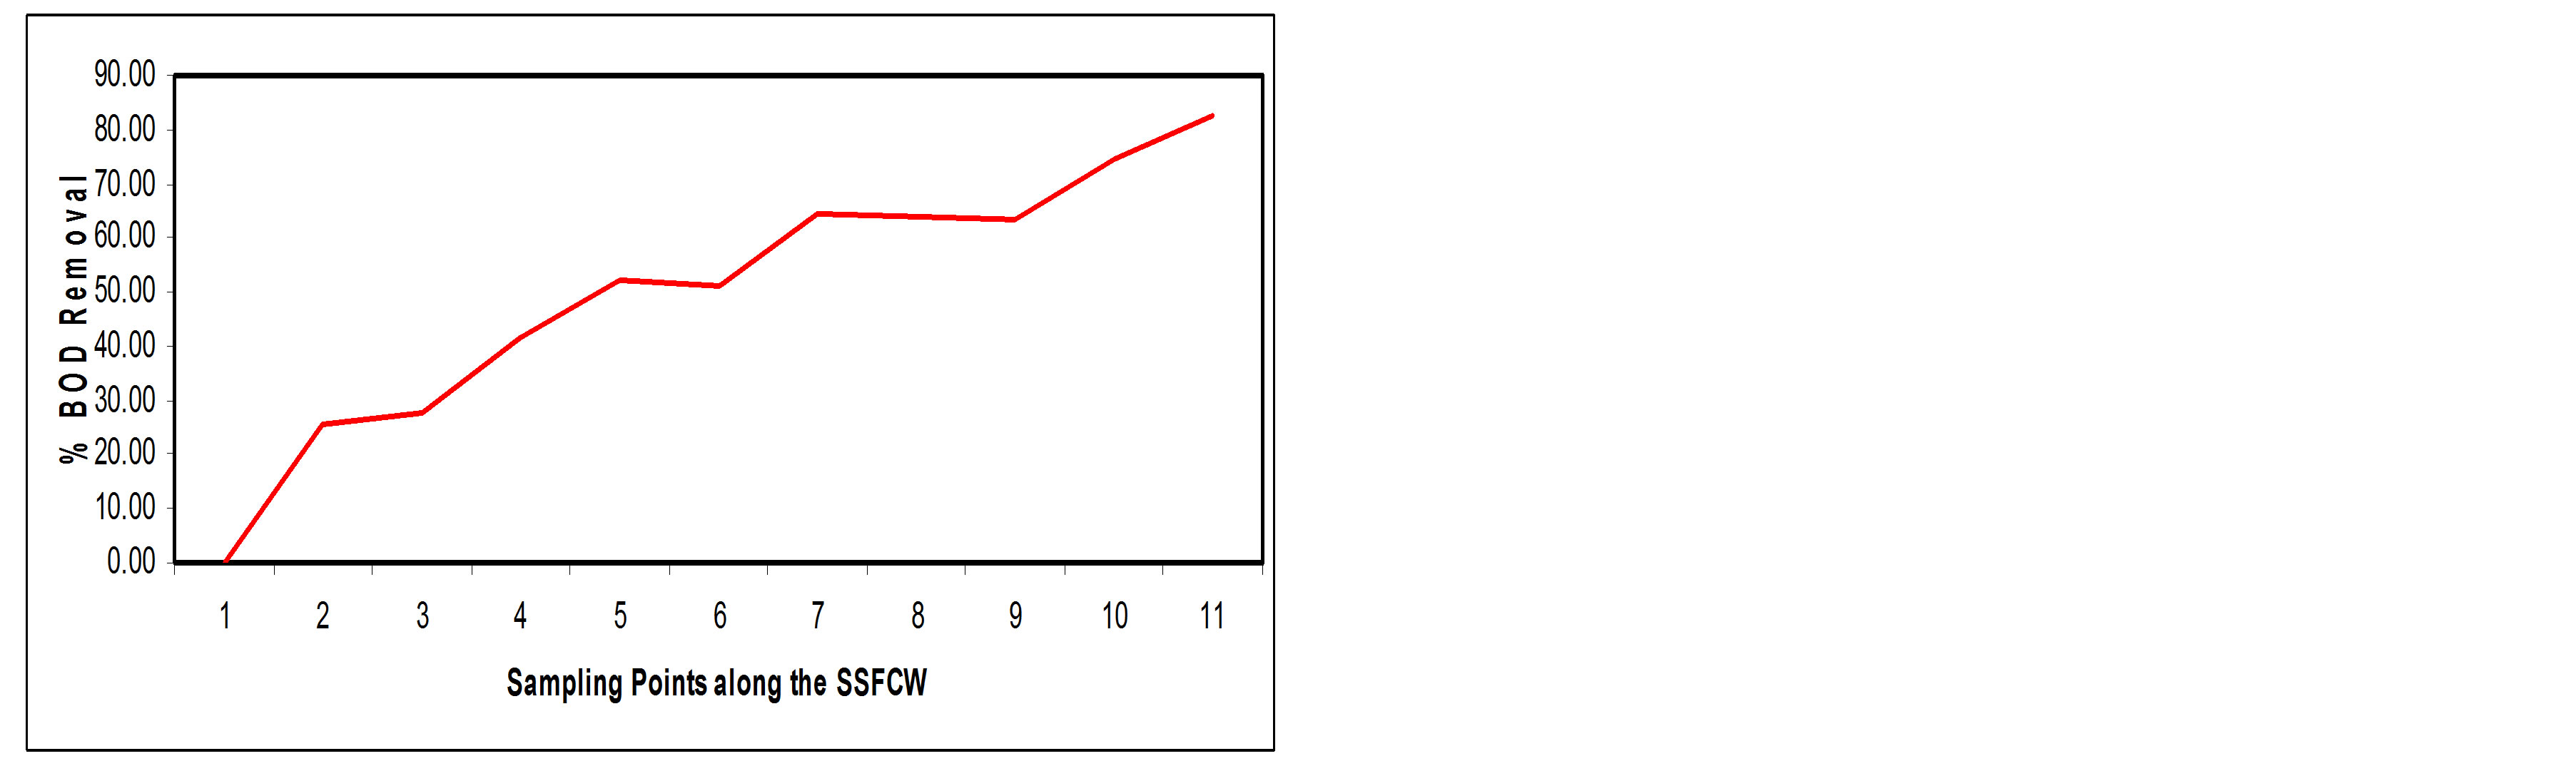 (b)
(b)
Figure 13. (a) BOD values at sampling points of the SSFCW; (b) % BOD removal at sampling points of the SSFCW.
usually through the E-coli. E-coli is a disease causing pathogen that can be present in drinking water and most definitely in sewage water.
This study reveals an appreciable reduction in total E-coli count from 874.18 MPN/100 ml at influent point (SP1) to a value of 0.15 MPN/100 ml at effluent point (SP11), this is a removal efficiency of about 82.50% (Figures 14(a) and (b)).
The main processes that are involved with pathogen removal include natural die-off, sedimentation, filtration, ultra-violet light ionization, unfavorable water chemistry, temperature effects, pH and predation by other organisms [21]. Also, the depth of the beds plays a significant role in the reduction of bacterial populations [14]. The depth of the constructed wetland in this study is 650 mm, which is shallow, may also account for the better efficiency in coliform removal.
4. Conclusion
Results from this study show that the constructed wetland system at the University of Lagos is efficient in the removal of biological and organic pollutants from domestic waste water. The removal efficiency of the facility for most physical, chemical and biological parameters is above average and the effluent values are within the
 (a)
(a)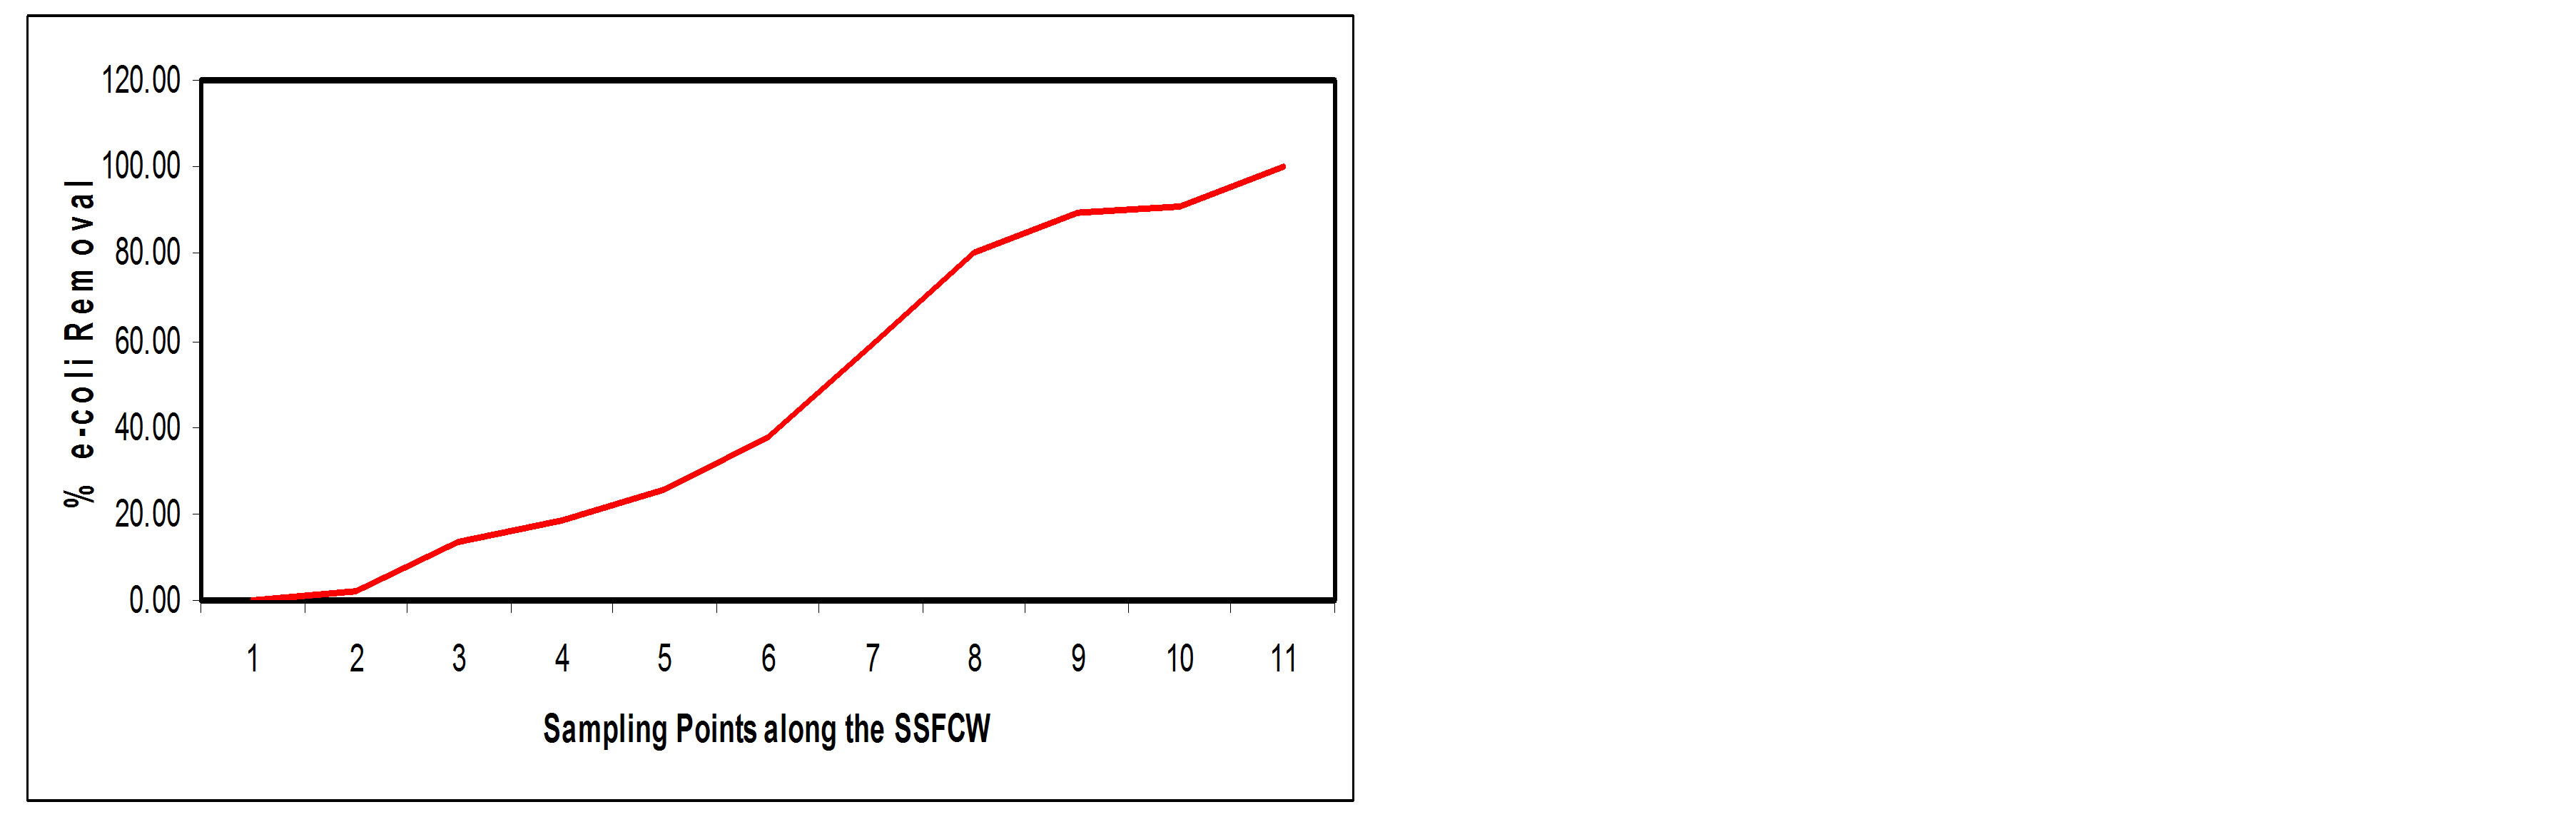 (b)
(b)
Figure 14. (a) E-coli values at Sampling Points of the SSFCW; (b) % E-coli Removal at Sampling Points of the SSFCW.
FEPA’s Effluent Limitation Guidelines in Nigeria [22] as shown. The study concludes that constructed wetland, apart from being a cheap and viable option for sewage treatment in Tropical Africa, is also efficient in the removal of pollutants during the treatment process.
NOTES