Generalized Estimating Equations for Repeated Measures Logistic Regression in Mosquito Dose-Response ()
1. Introduction
Dose-response studies in arthropod research usually involve observing and taking successive measurements of insects’ mortality on groups of insects subjected to different concentrations of stimulus [1,2], giving rise to repeated measures data. Mortality data collected several times on the same group of organisms at several concentrations over time are usually correlated [1-4] and cannot be analyzed using standard Probit analysis technique [5,6] which is the usual way of analyzing data from bioassay experiment [1,2]. Probit analysis is adequate if the responses are independent, true for data collected at once after a given time point [6]. In arthropod dose response studies, samples of insets are usually exposed to several concentrations of insecticide to determine the concentration that will kill 50% (LT50) of the insects within a given time span [6,7]. Effect of time on the percentage of kill at one or several concentration is of importance when the interest is in the speed of kill because mortality varies with time [1,2].
Given the correlated measurements in dose-response studies and when the interest is in the speed of kill, one has to move on to alternative method which accounts for the correlation in the data while estimating lethal time and of such methods is the Generalized Estimating Equations (GEE) [8]. With GEE correlated data can be modeled with output that looks similar to generalized linear models (GLMs) with independent observations by accounting for the within-subject covariance structure [9,10]. The available covariance structures specify how observations within a subject or cluster are correlated with each other [11].
Arthropod dose-response data may have a binary repeated measures response and therefore GEE in a logistic regression setting will be a good way to model the data [8,12,13]. Usually Logistic regression is a Generalized Linear Model (GLM) method for analyzing binary outcome [14,15] but ignores the correlated nature of the data. In this paper the use of repeated measures logistic regression using GEE is considered as complementary approach to LT50 estimation to address the limitation of Probit Analysis in estimating LT50 for correlated mosquito dose response data. GEE for repeated measures logistic regression was used because the data were binary and correlation because time was to be taken into account.
2. Methods
The data used in this paper were from a laboratory experiment on the effect of botanical extracts on mortality of larvae of anopheles mosquito (Anopheles gambiae) as part of malaria control project. Several botanical products were studied but in this paper we chose only three botanicals namely B,C,E and control D. The botanicals were studied at four concentration levels: 12.5 mg/ml, 50 mg/ml, 250 mg/ml and 500 mg/ml. Fifty larvae were dipped in glass beaker containing the specific botanical products at a specific concentration. Each concentration with specific botanical extracts was replicated three times. The response variable was larval mortality observed at 12 hrs, 24 hrs, 36 hrs, 48 hrs, 60 hrs and 72 hrs after exposure. There was no death in control which consisted of water only and hence does not appear in the analysis. The data collected had three factors; botanical extracts, concentrations and time. The data set was created for each extract at each concentration level as shown in Appendix 1. GEE model in a logistic regression setting was used to estimate LT50. R statistical software version R 2.14.1 was used in the data analysis.
2.1. Logistic Regression
Logistic (logit) regression is a type of regression analysis used for predicting the outcome of a categorical dependent variable based on one or more predictor variables [14, 15]. In arthropod dose-response mortality data is a set of Bernoulli trials which is a special case of Binomial distribution. The values of response  (mortality status) are 1 if there is a success and 0 otherwise. The binary response is the mortality status of 50 mosquito larva at time 12 hrs, 24 hrs, 36 hrs, 48 hrs, 60 hrs and 72 hours at a given concentration level. Generalized linear models (GLM) are a generalization of standard linear regression so that the response variables may have a distribution other than the Gaussian [14,15]. Logistic regression is the appropriate GLM when the data follows Bernoulli or Binomial distribution.
For a binary response variable  (mortality status), and a set of
  predictor variable (time),
  at a given concentration level with a logistic transformation or logit function, the logistic regression will be given by
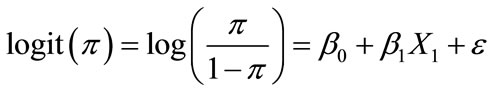 (1)
(1)
where  is the probability of success,
  is the intercept,
  is the regression coefficient for each corresponding predictor variable,
  (time), at a given concentration and
  is the error of the prediction [14,15].
2.2. Expressing Lethal Time (LT50) Using Logistic Regression
Consider Equation (1) in the form
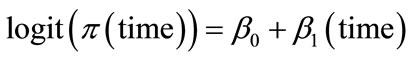 (2)
(2)
LT50 is the time at which  equals 0.5. [3,6] and by substituting
  with 0.5 in Equation (1) gets
 (3)
(3)
Any tests comparing lethal time values should include confidence limits of the estimated statistics [1]. Based on the asymptotic approximation, the variance of the LT50 computed using the delta method [4,12] is
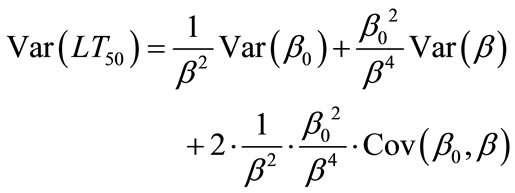 (4)
(4)
and hence an approximate 95% confidence interval (CI) for the LT50 is given by
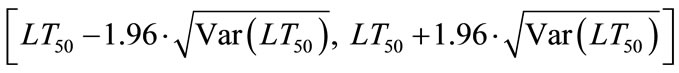 (5)
(5)
To account for correlation effect due to time (repeated measures), GEE is used to estimate the parameters  and
and  by specifying the correlation structure [10,16,17] to permit for the calculation of robust estimates for the standard error of the regression coefficients
2.3. Generalized Estimating Equations
Let ,
,  ,
,  denote the mortality status of mosquito larva
  after exposure to at a given concentration
  for a given botanical extract (
 , dead and
 , alive). Let
  be the time taken by mosquito larva
  to die after being exposed to concentration
 .
.  is assumed to follow a Bernoulli distribution when the probability that mosquito larva is dead and is denoted by
 , that is
  and this is also equal to the expected death
 .
.
The marginal logistic regression model for the data is
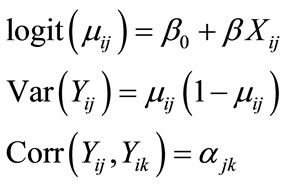 (6)
(6)
In this model the number of observations per cluster (time intervals) is small and in a balanced and complete design, hence unstructured correlation matrix [9,11,18]. The observations are correlated with no assumptions of the structure.
To use GEE in estimating, there are three-part specification; the conditional expectation of each response, the conditional variance of each  given the covariates and the covariance (correlation) matrix [10,16,17].
Let the marginal regression model to be:
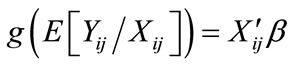 (7)
(7)
where  is a
is a  vector of covariates,
  consists of the
  regression parameters of interest (time)
  is the link function, and
  denotes the
  outcome
  for the
  mosquito larva/subject
 . For this paper the link function chosen was the logit link for binary data [9].
The GEE equation for vector  or the regression model (score) is given by
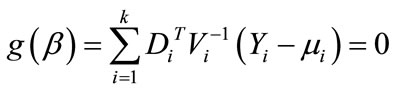 (8)
(8)
where  is the matrix of derivatives
 ,
,  is the “working” covariance matrix of
 .
.
Let  be an
be an  “working” correlation matrix that is fully specified by the vectors of parameter
  [8,9,16,18]. The variance-covariance matrix, part of the model used in the estimating equation, is:
 (9)
(9)
where  is a glm dispersion parameter to allow for over dispersion,
  is a diagonal matrix of variance functions
  i.e.
i.e.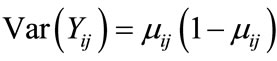 , and
, and  is the correlation matrix of
 .
.
2.4. Working Correlation Matrix
The working correlation matrix is usually unknown and must be estimated. It is estimated in the iterative fitting process by using the current value of the parameter vector . Common choices for the correlation structure within GEE include Independent, exchangeable, autoregressive (AR(1)), unstructured, M-dependent and User fixed [8-10,16-18].
2.5. Choosing the Correlation Structure in GEE
Quasi-likelihood Information Criterion (QIC) is usually applied to models fir by GEE to find an acceptable working correlation structure giving the least QIC [11].
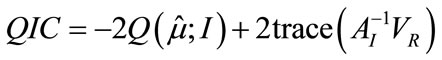 (10)
(10)
where  is the independent covariance structure used to calculate the quasi-likelihood.
  and
and  is the inverse link function for the model (logit).
  is the variance matrix under the assumption of independence model and
  is the robust variance estimator obtained from a general working covariance structure R. Prior knowledge on how the data was collected may also guide in choosing the best correlation structure to reflect the manner in which the data was collected [11]. LT50 is then estimated using repeated measures logistic regression which uses GEE as an implementing tool.
Given a mean model,  , and variance structure,
  , (“working” covariance matrix of
 ), the parameter estimates will be given by solving
  which is usually obtained via the Newton-Raphson algorithm or via iterations [16,17].
The covariance of matrix , is estimated using the model-based estimator and the empirical or robust estimator [9,10,17].
The model-based estimator of the covariance matrix of  is given by
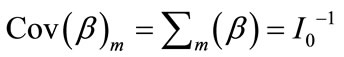 (11)
(11)
where
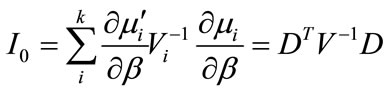 (12)
(12)
for this case  consistently estimates
  if the mean model and the working correlation are correct [8,9].
The empirical or robust estimator of the covariance matrix of  is given by
 (13)
(13)
where
 (14)
(14)
for this case  is a consistent estimator of
  even if the working correlation is misspecified [8,9].
3. Results
The results of lethal time determination for mosquito dose-response using repeated measures logistic regression via GEE are presented in Table 1. Across the three extracts concentration 500 mg/ml was the most potent chemical, followed by concentration 250 mg/ml, concentration 250 mg/ml and concentration 50 mg/ml in that order (Table 1, Figures 1 and 2).
Botanical extracts B, C and E were significantly different from each other in terms of insect mortality across
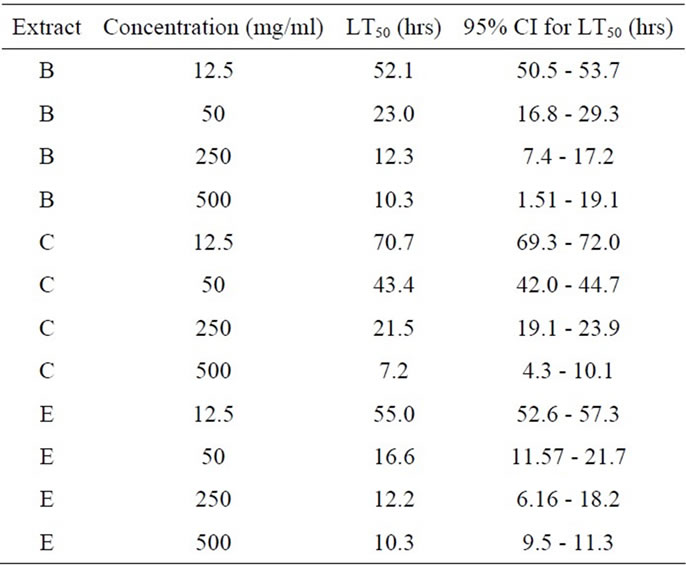
Table 1. LT50 estimates from repeated measures logistic regression using GEE.
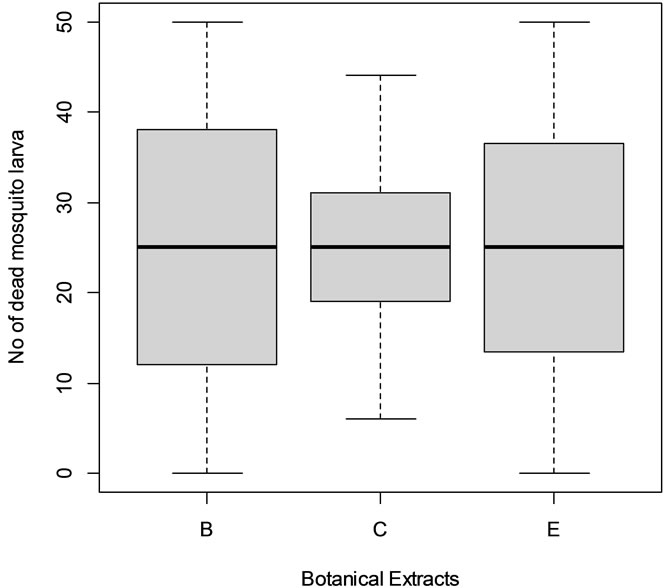
Figure 1. Box plot for extracts B, C and E.
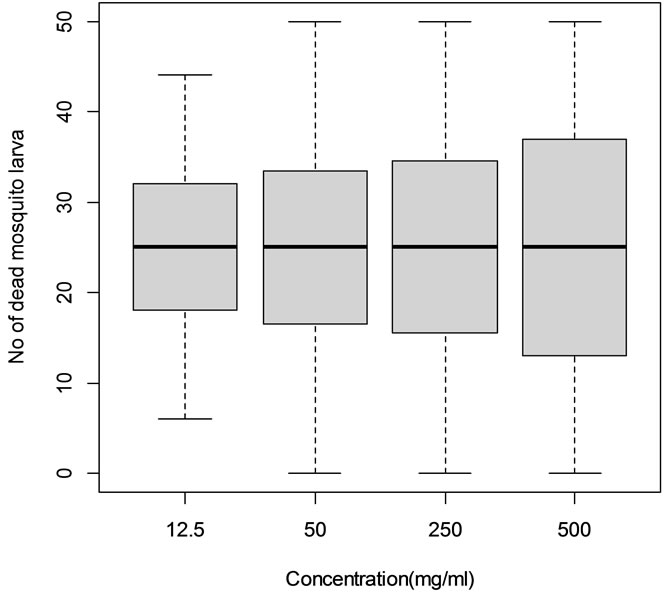
Figure 2. Box plot for concentration 12.5 mg/ml, 50 mg/ml, 250 mg/ml and 500 mg/ml.
all time points (Figure 1). The concentration levels 12.5 mg/ml, 50 mg/ml, 250 mg/ml and 500 mg/ml were different from each other in terms of insect mortality across all the time intervals (Figure 2).
Estimates of the lethal time (LT50) values with 95% CI for the different concentrations for the different botanical extracts against anopheles mosquito are shown in Table 1. The LT50 values ranged between 10.3 hrs to 52.1 hrs for extract B; between 7.2 hrs to 70.7 hrs for extract C and between 10.3 hrs to 55 hrs for extract E. The LT50 values for the different concentration levels ranged between 52.1 hrs to 70.7 hrs for concentration 12.5 mg/ml; between 16.6 hrs to 43.4 hrs for concentration 50 mg/ml; between 12.2 hrs to 21.5 hrs for concentration 250 mg/ml; and between 7.2 hrs to 10.3 hrs for concentration 500 mg/ml.
4. Discussion
This paper has used repeated measures logistic regression using GEE method to estimate LT50 in repeated measures for mosquito (arthropod) dose-response.
Estimating LT50 is of importance when the interest is in the speed of kill since mortality varies with time. It’s also of importance because observations made on the same group of organisms at different times are correlated and hence standard Probit analysis will not be applicable [1,18]. Repeated measure logistic regression using GEE was able to estimate LT50 for the different concentration levels together with their corresponding confidence intervals [1,4,12,13,19].
The analysis showed that concentration 500 mg/ml was the most potent chemical while concentration 12.5 mg/ml was least potent chemical. In studying the lethal effects of concentrations on mortality, higher concentration levels are usually more effective in regards to mortality [2,12,13,19] which seems to have been reflected in the estimated LT50 for the different concentrations. Concentration 500 mg/ml was the most potent chemical since it took shorter time to kill half of the insects’ population. Further research should be done to ascertain the claim of the estimated LT50 to rule out if there are effects of some other factors. LT50 and the confidence intervals of the estimates in this paper were similar with results from the same methods but applied in a different setting [12,19] to show that the method was versatile for analyzing repeated measures dose response data from arthropod studies.
The exact time of kill was not known in the GEE approach since time was used cumulatively to estimate if the mosquito larva has been killed at a particular time point. Effective data collection methods and use of existing methods of estimating LT50 should be used in a complementary fashion. Unstructured correlation matrix was the only one used in repeated measures logistic regression via GEE. Wider comparisons and use of QIC should be considered to make the research more representative.
The combined use of GEE approach together with other existing analytical methods for bioassay data may improve the way how repeated measures arthropod doseresponse data is being analyzed when the speed of kill is of interest [1,18].
As a complementary approach to Probit analysis and other existing methods for analyzing data from bioassay experiments, repeated measures logistic regression via GEE can be used as a tool to estimate LT50 more effectively in repeated measures arthropod data. Wider exploration of GEE techniques and further testing and refinement are needed to fully develop its promising capabilities.
5. Acknowledgements
The authors acknowledge Jomo Kenyatta University of Science and Technology (JKUAT), African Insect Science for Food and Health (ICIPE) and Regional Universities Forum for Capacity Building in Agriculture (RUFORUM) for their support. This work was undertaken by the lead author as an MSc research at JKUAT.
Appendix
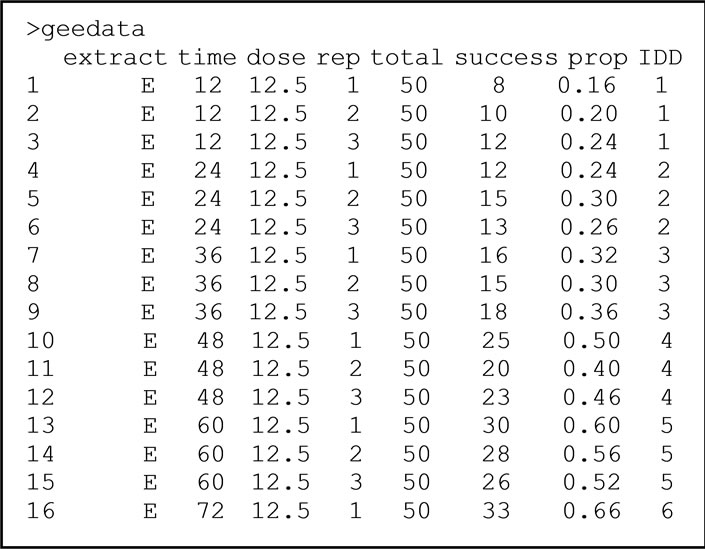
Appendix 1. Data format for repeated measure logistic regression using GEE.