1. Introduction
The Gulf of Aqaba (GOA) is one of the two narrow northward Gulfs of the Red Sea. It is located within 34˚20' - 35˚00'E and 27˚54' - 29˚35'N (Figure 1). It is 180 km long, 14 - 26 km wide, and has an average area of 3300 km2 and average water depth of 800 m. The maximum depth of the gulf approaches 1800 m. The Gulf is part of the Syrian-African rift valley and is flanked by mountains and desert on both the east and west sides. The southern end of the Gulf is separated from the Red Sea by a shallow sill (maximum depth 270 m) at the Straits of Tiran [1]. GOA is of interest because it hosts an ecological system that includes coral reefs and other tropical biotathat are unique in such high latitudes [2]. The climate of this region is arid with an average net evaporation of 5 - 10 mm/day [3] and with no permanent rivers flowing into the Gulf. As a result, the waters of the Gulf are among the most saline in the world, with typical salinity values of 40.5 × 10³ parts per million (ppm) or more. Throughout the year, the wind blows predominantly from the north (over 90% of the time), which further enhances the evaporation and the resulting thermocline circulation. The consensual view of the general circulation in the Gulf, as described by [4] and cited in numerous studies thereafter (e.g., [1,5-10]) is that throughout the year, the net buoyancy loss due to large evaporation and heat loss drives an inverse estuarine circulation, causing a northward flow of warm and low-salinity surface water from the Red Sea into the Gulf. As the surface water flows northward, it becomes denser through cooling and evaporation. When the water reaches the northern end of the Gulf, it sinks and returns to the Red Sea as a dense layer, out flowing in the lower level of the Straits of Tiran.
Studies of the Straits of Tiran indeed mention a twolayer exchange flow [11-13], with relatively light Red Sea water entering the Gulf through the upper 80 - 90 m of the water column [12], and denser Gulf water flowing out through the bottom layer. However, all of these studies were conducted for short periods of time during the winter months. Thus the seasonal changes in the exchange flux remain unknown.
Being a semi-enclosed basin, GOA is potentially vulnerable to pollution, particularly at its northern tip.

Figure 1. Location map and bathymetry of the entire Red Sea (left panel) and the GOA (right panel). Bathymetry data is extracted from the global bathymetry dataset for the world ocean “GEBCO_08”.
Therefore, any coastal activities at this coastal region of the Gulf should be carefully investigated to examine their impact on the current conditions. The hydrodynamics of GOA was previously investigated through field observations and development of 2D hydrodynamic models of tidal variations and currents [1,8,13-17].
One of the coastal activities that are carried out on the gulf water is the desalination activities where fresh seawater extraction and brine disposal from/to the sea is performed. As the scarcity of water in the region is increasing more pressure on desalination of sea water activities is foreseen. This is a fact in most of the region however the main issue in the Gulf of Aqaba is its vulnerability to pollution.
In this paper, numerical investigation on the impact of the implementation of a desalination activity located on the northern end of the GOA is performed. The investigation evaluates the impact of the abstraction/disposal of sea water on the GOA environment. The studied scenarios are basically 1) only abstraction of large quantities of sea water, and 2) abstraction of large quantities of sea water and disposal of desalinated brine to the GOA. It is likely that withdrawal of large quantities of water may induce negative impact on the marine environment [18].
This study aims at developing a basin-wide 3D hydrodynamic modeling framework for assessing the impacts of different abstraction/disposal scenarios on the hydrodynamic circulation and marine environment of GOA. The model was constructed using Delft-3D model package. The developed model, at the present stage, is preliminary where the results provide qualitative assessment on the potential impacts on the water circulation. Accordingly, this study is considered a pace ahead for a better model development and validation in the future studies.
2. Data Collection
The first step in developing the 3D hydrodynamic model for the Gulf is to define and collect the basic data required for the model development. These data include the geography and bathymetric data of the Gulf, the basic inflows and outflows from the Gulf and the meteorological parameters specially the ones affecting the hydrodynamic analysis.
It is worth to mention that limited data were available during the development of the model and to note also that measurements for calibration were very limited.
The data that were made available during the model development include the following:
• The model bathymetry was based on the acquired global bathymetry dataset for the world ocean “GEBCO_08” [19] available at http://www.gebco.net. GEBCO-08 is a global 30 arc-second horizontal resolution. Data for the GOA were extracted from the global dataset and converted into the appropriate file format for establishing the numerical modeling.
• Land boundary were extracted from the GEBCO-08 dataset assuming that grid points with elevation greater than zero are to be considered as land points.
• The inflow from natural streams to the sea is very limited and accordingly was not considered in the study.
3. Model Development
The large-scale hydrodynamics and the associated mass transport in the deep GOA are clearly three-dimensional phenomena. Strong horizontal as well as vertical gradients in water temperature are observed, [5]. The spatial variation resulted from, among other factors, elongated shape, wind driven flow, and upwelling/down-welling as controlled by thermal stratification, [16]. This assessment advocated the development of coherent three-dimensional model. The 3D modeling framework for the GOA was established using the hydrodynamic Delft3D-FLOW model. This model is embedded in the Delft-3D user friendly interface.
3.1. Model Setup
A detailed curvilinear 3-D grid was developed. The 3-D grid was selected to represent the thermal stratification and to capture for the natural thermocline circulation in the gulf. The resulting 3-D computational grid for GOA is shown in Figure 2.
The horizontal grid contains 209 cells along the gulf centerline and 21 in the transversal direction and is expressed in the spherical coordinate system. As stated earlier, the water depth at each grid point was made using the global bathymetry dataset for the world ocean “GEBCO_08” with 30 arc-second horizontal resolutions (about 1 km).
As for vertical resolution, 30 layers were applied. The vertical layers are defined in a so called sigma co-ordinate system. In this system, each layer has a thickness that is a constant fraction of the local water depth. Because of the complex dynamics in the upper part of the water column characterized by temperature gradients and stratification, thin layers were chosen at the water surface

Figure 2. The curvilinear grid and schematized bathymetry for GOA: (a) in the hydrodynamic model via DELFT3DFLOW; (b) Computational grid and bathymetry in the northern end of the gulf near the city of Aqaba and (c) The southern-open end of the gulf at the straits of Tiran.
and thick layers near the bottom. The top layer fraction was chosen as 1% of the water depth; so with a maximum depth of 1700 m the maximum top layer thickness is 17 m and the maximum bottom layers thickness is about 85 m.
3.2. Initial and Boundary Conditions
As any other hydrodynamic model, The Delft3D-Flow model requires initial and boundary conditions as well as meteorological and heat forcing. The hydrographic data for initializing the model were applied uniformly over the computational grid (uniform water temperature of about 27˚C and uniform salinity of 40.6 × 10³ ppm. A water level boundary driven with astronomical constituents is applied at the southern boundary of the model (Figure 3). Four astronomic tidal constituents (O1, K1, S2, and M2)—obtained from the Admiralty Tide Tables Volume 3 prepared by UK Hydrographic Office in 2007 [20]—were employed to estimate the water level at the southern open boundary. The water level varies from about 0.17 m to 0.87 with 0.70 m tidal range. Temperature and salinity profiles, shown in Figure 4, were specified at the southern open boundary. These profiles were extracted from a continuous record observed at a hydrographic station located 10 km south of the north end of the GOA in accordance with reference [18]. Along the east, west, and north coasts of the gulf, a condition of normal flow was assumed, i.e. u = 0 on the east and west coasts and v = 0 on the north coast. The heat flux computations were turned off in the current set of experiments due to the unavailability of required meteorological forcing data. In case of GOA, no rivers and related data are required in the gulf.

Figure 3. Water level variation based on astronomic tidal constituents applied uniformly at the model southern boundary.

Figure 4. Vertical temperature and salinity profiles applied at the model southern boundary. The profiles were observed in July 2005 at a station located 10 km south of the north end of the GOA (RSS, 2010).
4. Development of Simulation Scenarios
Five numerical simulations were performed; the first experiment simulates the present condition as a baseline for comparing the impact of the proposed intake/outfalls. The second and third experiments simulate hypothetical abstraction/disposal volumes for an intake only located at 250 m off the northern coast of the Gulf (2nd experiment) and intake at about 500 m off and an outfall at about 1500 m off the eastern coast of the Gulf close to Jordan-Saudi Arabia boarder (3rd experiment). The fourth and fifth experiments simulate another proposals for abstraction/disposal volumes for an intake at about 500 m off the northern coast of the Gulf and an outfall at about 1000 m off the eastern coast of the Gulf (4th experiment), and an intake at about 500 m off the northern coast of the Gulf and desalination brine mixed with the cooling water and disposed via an open channel located at the eastern coast of the Gulf (5th experiment). Table 1 summarizes different characteristics of the performed numerical simulations. Locations of the intake/ outfall for each experiment are illustrated in Figure 8.
5. Results and Discussion
5.1. Results of the Hydrodynamic Computations for Present Condition
A one-month simulation time was specified for the summer season during the month of July for all scenarios. The model reproduced the main characteristics of the gulf circulation and hydrography as compared to the previous studies and the available data. This could be demonstrated as follows:
The surface flow field is rather complex (Figure 5), and is composed of a chain of eddies/circulations along the main axes of the gulf as reported in previous modeling studies carried by [1,2,13,21] and in current measurements along the basin by [13]. The general circulation consists of relatively warm and fresh water that enters from the south through the Straits of Tiran as a surface layer, and flows northward, whereas the cold and saline water of the Gulf exits as the bottom layer of the exchange flux.
The model reproduced the thermal stratification in summer (July) as revealed from the typical vertical temperature profile, Figure 6. A temperature gradient of about 6˚C exists between warm surface layer and the relatively cool deep water. Conforming to the observed temperature profile shown in Figure 4, with a relatively milder vertical temperature gradient at the surface, the

Figure 5. A snapshot of the surface flow field in the GOA that composes of a chain of eddies along the Gulf. The color scale represents the current velocity magnitude.

Table 1. Attributes of the conducted GOA numerical experiments.
computed surface temperature does not exceed 28˚C and the deepwater temperature does not go below 21˚C.
The distribution of the water temperature along the Gulf centerline (Figure 7) shows a positive temperature gradient in the south-north direction that result in warmer temperatures near northern end of the Gulf and proving suitable conditions of deepwater formation at the northern tip of the gulf.
5.2. Effect of Abstraction and Disposal Scenarios
To investigate the effect of abstraction/disposal alternatives on the GOA conditions, three reference X-SECTIONS were selected across the Gulf (refer to Figure 8 for location), namely X-SECTION50 near the middle of the Gulf, X-SECTION100 at the northern 1/3 of the Gulf, and X-SECTION200 at the northern end of the Gulf. Maximum flow velocity magnitudes from the present condition situation were compared to the corresponding values from the abstraction/disposal experiments. In addition to the absolute maximum velocity magnitude, the
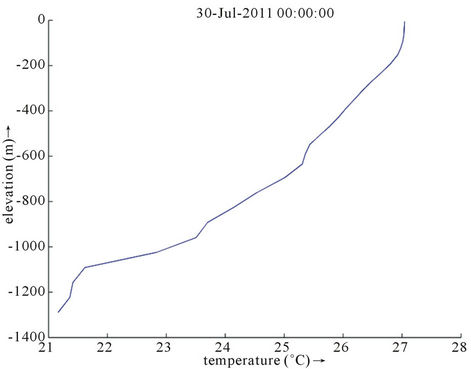
Figure 6. Typical computed temperature profile at a point near the south of the GOA in summer (maximum temperature at surface reaches about 28˚C and minimum temperature do not go beyond 21˚C).
residual maximum velocity magnitude for each alternative was computed and presented noting that the residual velocity magnitude is calculated as the maximum velocity for the alternative minus the maximum velocity in the present condition.
Figure 9 shows the maximum and residual maximum