Cervical cancer screening: hTERC gene amplification detection by FISH in comparison with conventional methods ()
1. INTRODUCTION
Cervical cancer remains one of the leading causes of female death, with an estimated 529,000 new cases and 274,000 deaths in 2008 worldwide, about 88% of which occur in developing countries [1]. The average time for progression of cervical intraepithelial neoplasia (CIN) to invasive cancer has been expected to be 10 to 15 years [2], allowing valuable time windows for early detection and possible preventive treatment of cancer or precancer. In developed countries, the widespread introduction of cervical screening programmes has been credited with reducing the incidence of invasive cervical cancer by 50% or more. Nevertheless, cervical cancer prevention is still an important and arduous task of the whole world, especially of developing countries.
At present, several methods are recommended to screen for cervical cancer, such as the Pap smear, liquid-based cytology (LBC) and human papillomavirus (HPV) testing. The conventional Pap smear has been the principal screening test for cervical cancer since its introduction in the 1940s. However, it can only correctly identified 30% to 87% of women with precancerous lesions [3]. As an alternative to the Pap smear, LBC was approved by the US Food and Drug Administration (FDA) since 1996. Although LBC approach is proved easier and quicker to scan and with fewer unsatisfactory specimens, controversy remains about its diagnostic accuracy [4]. Actually, some large prospective randomized controlled trials found no difference between the two cytological methods in terms of relative sensitivity and positive predictive value (PPV) for detection of cervical cancer precursors [4, 5]. In view of the fact that persistent infection with oncogenic HPV is a necessary risk factor for the development of nearly all cases of cervical cancer [6], molecular detection of HPV DNA is appraised as an alternative or adjunctive test to cytology. Studies suggest that the HPV testing has a very high sensitivity (92% - 98%) and an excellent negative predictive value (NPV) [7], thus could potentially serve as a better primary screening method [8, 9]. Its specificity (46% - 54%), however, is significantly lower than that of cytology for the detection of high grade cervical squamous intraepithelial lesion (HSIL) lesions. Overall, none of the above conventional methods is satisfactory enough for cervical cancer screening. New idea and means is needed to supplement the current screening strategy in detection of cervical cancer and premalignant cervical lesions.
Recently, many researches find that genomic amplification of the human telomerase RNA component (hTERC) is a strongly associated event in the progression of the carcinogenesis of cervical carcinoma [10]. The hTERC gene amplification could induce tumor formation by promoting the proliferative capacity of many human cancers [11]. Several studies suggest hTERC gene amplification as a promising diagnostic marker for routine cervical cancer screening to improve the screening accuracy [12,13]. It has been reported that hTERC gene copy number increases with the severity of dysplasia [14] and is likely to be used for triage of women with HPV-positive, abnormal cytology [15]. However, the diagnostic value indices such as specificity, sensitivity, PPVand NPV vary greatly from different studies since there is still no standard threashold for positive hTERC gain [13,16]. Thus the clinical significance of hTERC amplification for cervical cancer screening might not be properly evaluated. The aim of this study is to assess the optimal threashold of hTERC amplification for cervical cancer screening by fluorescence in situ hybridization (FISH) and compare its abilities to discriminate HSIL or higher from LSIL or lower with that of current screening methods within the same group.
2. MATERIALS AND METHODS
2.1. Subjects
One hundred and nine women from outpatient clinic were included in this study during the period from June 2008 to Dec 2009. Their mean age was 36.5, with a range of 21 to 61 years of age. All of them had liquid-based thin-layer cytopathologic examinations (thin-prep cytologic test, TCT), HPV DNA testing and FISH analysis with the hTERC-specific probe. In addition, colposcopically directed biopsy and/or cone biopsy were conducted for definite histopathologic diagnosis for each case. They were then devided into four groups according to ultimate histopathological diagnosis, including benign lesion (normal or cervicitis) group, LSIL (CIN1 or condyloma latum) group, HSIL (CIN2/3 or carcinoma in situ) group and invasive carcinoma of cervix (ICC) group. There were no significant differences of age within groups except for that between ICC group and normal group (see Table 1).
2.2. Cervical Cell Collection and Cytopathologic and Histopathologic Examinations
Cytopathologic examination was performed after standard TCT management of the sample and was reported according to the 2001 revision of the Bethesda system [17], including normal or benign cellular changes (NILM), atypical squamous cells (ASC) including atypical squamous cells of undetermined significance (ASCUS), atypical squamous cells cannot exclude a high-grade lesion (ASCH), low-grade squamous intraepithelial lesion (LSIL), and high-grade squamous intraepithelial lesion (HSIL) and squamous cell carcinomas (SCC).
Histopathological diagnosis of all 109 subjects were made according to colposcopy-directed cervical biopsy and/or cone biopsy results. If the results of colposcopydirected cervical biopsy and cone biopsy are not in complete agreement, the severer one was admitted as ultimate histopathological diagnosis.
2.3. High-Risk HPV DNA Test
Cervical cells were collected and used for high-risk HPV detection with the Digene Hybrid Capture 2 method (Qiagen, Gaithersburg, MD) according to the instruction. A total of 13 types of high risk HPV were detected (16, 18, 31, 33, 35, 39, 45, 51, 52, 56, 58, 59 and 68) HPV DNA measured at >1 pg/mL was regarded as a positive result.

Table 1. Age of patients in different group.
2.4. Detection of hTERC Amplification by FISH in TCT Samples
Cervical cells were collected by turning the sampling brush at the squamocolumnar junction of the cervix for five circles just as the same specimens as TCT. A dualcolor FISH using a TERC-specific DNA (labeled in red, rhodamine) and the the chromosome 3 centromere-specific probe (CSP 3) (in green, fluorescein isothiocyanate) was performed on TCT collection specimens to detect the hTERC gene copy number as previously described [18].
In brief, the fresh collected cervical cells were firstly incubated with collagenase B and hypotonic KCl solution in turn at 37˚C for 20 minutes. After fixation, the cells were smeared onto slides and air-dried prior to hybridization.
For FISH hybridization, the prepared slides were pretreated with pepsin in 0.01 mol/L HCl at 37˚C for 10 minutes. Ten mL of the hybridization mix consisting of 2 mL probe, 7 mL hybridizing buffer and 1 mL deionized water were applied to each slide. They were denatured separately in 70% formamide/2 × SSC at 75˚C for 5 minutes and then hybridizated at 42˚C overnight. The following day, the slides were washed in 50% formamide/2 × SSC at 46˚C for 10 minutes 3 times, 2× SSC for 10 minutes, 0.1% NP-40/2XSSC solution for 5 minutes in turn. After carefully air-dried, the slides were counterstained with DAPI in dark at room tempreture for 20 minutes. The slides were viewed at 1000× magnification on an Olympus BX51 Fluorescence Microscope (Olympus, Tokyo, Japan). The images were captured and analyzed using the FISH 2.0 system. The percentage of cells with hTERC gene amplification was evaluated in 100 analysable nuclei per specimen. More than two hTERC-specific red signals and no less than 2 green signals per nuclei, including polyploidies and chromosomal instability (aneuploid) which may be the early events during cervical carcinogenesis [10,19], were defined as an abnormal hTERC amplification cell just as previously reported [13,17], otherwise normal (Figure 1). The percentage of abnormal hTERC amplification cells was recorded. However, we did not record the number of FISH signals per nuclei separately since both gain and aneusomy or polyploidies were abnormal amplification patterns of the TERC gene and strongly associated with progression. Based on ROC curve analysis, threshold value of the percentage of abnormal TERC amplification cells was determined.
2.5. Statistical Methods
Calculations were performed with SPSS for Windows 16.0. The x2 test was used to evaluate the results, and statistical significance was set at P < 0.05. Receiver Operating Characteristic (ROC) were used to determine the threshold of the percentage of abnormal TERC amplification cells and Area Under the Curve (AUC) were used to evaluate the diagnositic accurity of these three screening methods for differentiation between LSIL and HSIL or greater.
3. RESULTS
Among the 109 patients, 18 were normal or cervicitis, 17 were LSIL, 66 were HSIL and 8 were invasive carcinoma of cervix. Of them, FISH detection positive for hTERC gene amplification was found in 0.0% (0/18) of normal specimens, 11.8% (2/17) of LSIL, 74.2% (49/66) of HSIL and 100.0% (8/8) of ICC, respectively. The number of cells with hTERC gene amplification in 100 analysable nuclei per specimen was shown in Figure 2.

Figure 1. hTERC Detected by FISH in TCT samples. (a) Normal nuclei without amplification of hTERC (red-green, 2:2). (b)-(d), Positive nuclei with amplification of hTERC (red-green, 3:2, 4:3 and 4:4, respectively).

Figure 2. The number of cells with hTERC gene amplification in 100 analysable nuclei per specimen. Greater than or equal to 6% is considered FISH positive.
The mean percentages of cells with hTERC gene amplification in normal or cervicitis, LSIL, HSIL, and SCC groups were 1.17%, 2.53%, 27.45%, and 52.88%, respectively. The positive rates of hTERC gene amplification were significantly higher in HSIL and ICC compared with normal and LSIL (all P < 0.01). The incidence rates of HR-HPV infection of those with normal/ cervicitis, LSIL, HSIL and ICC were 27.8% (5/18), 70.6% (12/17), 90.9% (60/66) and 100.0% (8/8), respecttively. The incidence rates of cytological abnormality (≥ ASC) of those with normal/cervicitis, LSIL, HSIL and ICC were 5.6% (1/18), 47.1% (8/17), 78.8% (52/66) and 100.0% (8/8), respectively. These are reported in Table 2 and Table 3.
To determine the threshold value of hTERC amplifycation copy number for screening of HSIL or higher, ROC curve was measured. The optimal cut-off point of hTERC amplification copy number was calculated as 5.5 according to Youden’s index (J), J = maximum{sensitivity + specificity – 1} [20] and the threshold value was determined as 6%. Thus greater than or equal to 6% is considered FISH positive (see Table 2 and Figures 2, 3). Using this threshold the TERC test reached a specificity of 94.3% (33/35) and a sensitivity of 77.0% (57/74) to distinguish benign and LSIL from HSIL and cancer (see Table 3). The sensitivity, spectivity, NPV, PPV and acurracy of FISH, TCT and HPV test were compared as Table 4. The study compared the abilities to discriminate HSIL or higher from LSIL or lower of three screening methods using Area Under the Curve and found that
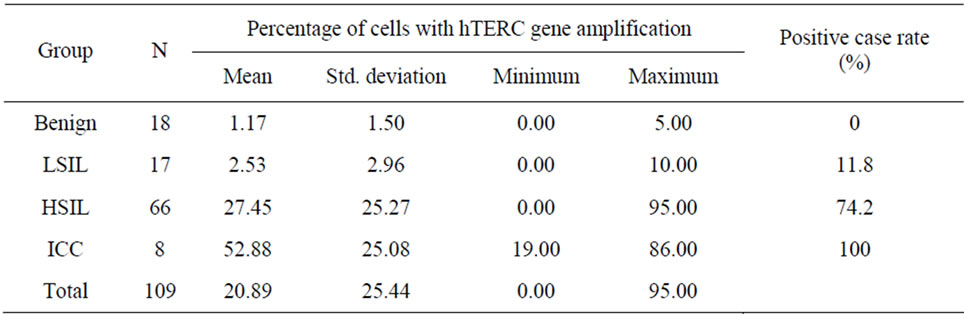
Table 2. Percentage of cells with hTERC gene amplification and positive case rate in each histopathology group.

Table 3. Distribution of abnormal Cytology, HPV positive and hTERC gain cases in each histopathology group.
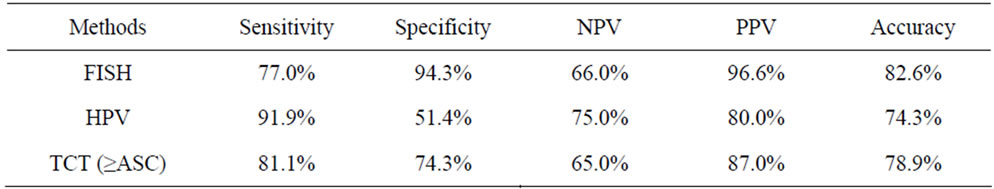
Table 4. Comparison of FISH detection of hTERC amplification with HPV test and TCT in discrimination of HSIL or higher from LSIL or lower.
hTERC amplification test performed more accurately (area under the curve = 0.857) compared to HPV test (area under the curve = 0.717) and cytology (area under the curve = 0.777), which indicated that the hTERC gene ree screening methods for discrimination of HSIL and LSIL lesions. These differences turn out to be statisticcally different (all P < 0.001). See Figure 3.
The rate of hTERC gene amplification was higher in HPV positive patients than in HPV negative patients (63.5% vs 20.8%, P < 0.01). The positive rate was significantly lower in normal cytology, ASCUS, ASC-H and LSIL compared with HSIL (all P < 0.01). Further correlation analysis revealed a significant relationship between the hTERC amplification and HPV test, cytology or histopathology (N = 109, all P < 0.01 (2-tailed), see Table 5), indicating that there is some intrinsic relationship for their roles in mechanism of cervical carcinogenesis.
4. DISCUSSION
This paper examined the clinical significance of hTERC amplification for cervical cancer screening detected by
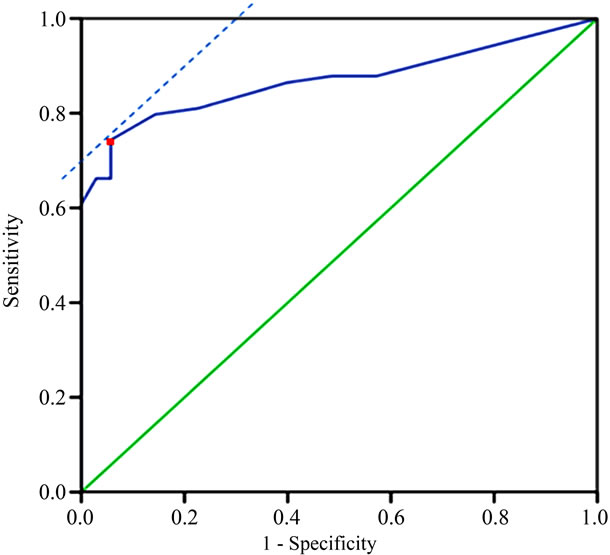
Figure 3. ROC curve analysis of the threshold of percentages of cells with hTERC gene amplification in discrimination of HSIL or higher from LSIL or lower. Red point refers to the optimal cut-off point.

Table 5. Correlation analysis of FISH detection of hTERC amplification and other screening or diagnosis methods.
fluorescence in situ hybridization (FISH) and compare it with that of current screening methods within the same group. Results suggest that hTERC amplification testing has higher accuracy than conventional cytology or HPV test in diagnosis of HSIL or ICC. Such advantage of hTERC amplification testing is especially important for clinicians because the treatment of high-grade dysplasia generally would be much more aggressive than lowgrade dysplasia. As in many earlier researches, our results proved the diagnostic potential of genomic amplification of hTERC as a powerful biomarker for cervical screening.
The present study showed that hTERC amplification testing has a very high specificity (94.3%) and positive predictive value (96.6%) but relatively low sensitivity (77.0%) and negative predictive value (66.0%) for the detection of HSIL lesions or higher, indicating that hTERC amplification testing has an excellent complementation effects with HPV test. If combined HPV test with FISH detection of hTERC amplification, most of LSIL or lower cases with HPV positive results could be correctly identified. Our results support the opinion that FISH detection of hTERC amplification should be used as a triage of HPV test or cytology but not primary testing to cervical screening.
In this study, we use ROC curve, which could obtain the best integrated sensitivity and spectivity for a quantitative diagnostic test [14,15,20], to investigate the threshold value of hTERC amplification rate. It is undoubtly important to set up threshold value for a test since it directly affects the interpretation of the results. However, there is still no unified standard of threshold value that indicates FISH detection positive for HSIL or higher, which inevitablely results in widely different estimations for clinical value of FISH detection of hTERC amplification. Caraway et al. [21] considered FISH detection positive if only two or more hTERC positive nuclie were detected in the speciment. In this approach, high sensitivity (100%) and negative predictive value (100%) they got whereas the specificity (72%) and positive predictive value (36.2%) were relatively low [22]. However, also 70% of the LSIL lesions were scored as positive. Some other studies evaluated the threshold based on the mean value plus 3X SD of priliminary results of 20 NILM and HPV negative subjects [16,18,23]. Thus they set the threshold to 4% - 6.4% and got high specificity (95.0%) while they could detect only 82.2% of the CIN 2 or higher using FISH to detect the amplification of hTERC. By using three deviations above the mean, the result attained was 99.7% chance to consider an abnormal hTERC amplification given that the data follows a normal distribution. However, this calculation method aims at discriminating between normal cervicus and CIN but not between LSIL and HSIL. What is more, we did observe a skewed distribution for the small samples. Undoutedly ROC curves would be a more credible classification algorithms than such rough formula. In another study, Heselmeyer-Haddad et al. yield a much higher threshold of 20% using ROC curves [24]. Specifically, the threshold they obteined was used for predicting progression from CIN1/CIN2 to CIN3. Moreover, their FISH procedure was done on previously stained Pap smears, which also contributed to their high threshold. Thus it can be seen that ROC curve is also competent for specified study object. Therefore we suggested ROC curve as a standard estimation tool to determine the threshold value of hTERC amplification rate in consideration of its accepted scientificity and high efficiency. However, more appropriate threshold value of hTERC amplification rate should be further determined by ROC analysis in large sample database for respective FISH diagnostic kit or special protocol of study.
Using area under the ROC curve (AUC), our data effectively verified the higher accuracy of FISH detection of hTERC amplification than that of either cytology or HPV test in detection of CIN 2 or higher. In a previous study, Li et al. also suggested that the detection of hTERC amplification had a much higher accuracy (87.56%) than the cytological (80.10%) and HPV DNA test (77.61%) findings [16]. However, they compared the accuracy of these three methods directly using selectively choosed samples that recruited relatively much higher proportion (47.26%) of cytological abnormal speciments. So the sensitivity, specificity and accuracy they obtained did not fully reflect the actual state in population and thus should not be compared directly. To overcome this problem, AUC was used to compare their abilities to discriminate HSIL or higher from LSIL or lower in this study. The AUC has been proved to be a powerful means to measure the ability of the test to correctly classify those with and without the disease. A larger AUC represents more accurate and reliable the diagnostic method is. So it is useful to assess the best diagnostic tool by comparation of many diagnostic or screening tests for one target disease. Interestingly, FISH detection of hTERC amplification has the highest AUC within these three screening methods, which indicated that it could provide a better discrimination tool than either HPV test or cytology for detection of HSIL or higher. To the best of our knowledge, this is for the first time that the ability of these three screening methods in discrimination of HISL or higher were effectively compared. Our findings suggested FISH detection of hTERC gene amplification as a promising discrimination test in detection of high grade cervical lesions to improve the accuracy of routine screening tools.
This study found a significant positive correlation between positive hTERC gain and HR-HPV infection, abnormal cytological or histopathologic lesions (all P < 0.01) in patients with cervical diseases. One explanation for this finding is that they all are associated events which successively occur in the carcinogenic progression of cervical carcinoma[10]; besides, it was well known that hTERC amplification level could be regulated by HPV E6 protein [25]. In a previous study, Takac et al. [26] found no significant difference in frequency of hTERC amplification between patients with low-grade CIN and those with high-grade CIN and no correlation between hTERC amplification and HR-HPV infection in CIN patients. The possible explanation for this discrepancy seems to be that amplification of hTERC they found in CIN is only 33.3% (31/93), which is much lower than that in the present study (64.8%, 59/91) and many other reports. However, they still found significant corrrlations between infection of HR-HPV and hTERC amplification in subgroups of CIN 1 and CIN 2. Once again, more detailed evaluation about the relationship between hTERC amplification and HR-HPV infection would be needed in large sample studies. In conclusion, our data show that hTERC amplification testing, as a hopeful evaluation method used to screen women for cervical precancer or cancer, has its own advantages and application value. A large, ongoing prospective observational study is required for further evaluation of its use value, especially on the role of triage of current conventional screening methods and its relationship with the clinical progression and outcome of cervical lesions. With respect to FISH approach, it is obviously less subjective than conventional cytology, but more tedious and timeconsuming than HPV test. Such drawback will be overcomed if FISH could be combined with automatization technique in near future.
5. ACKNOWLEDGEMENTS
The project was supported in part by the Shanghai Committee of Science and Technology, China (Grant No. 10411961000).
NOTES