Comparative Evaluation of the Effects of Velogenic Newcastle Disease Virus Infection on the Hematology of Ducks and Chickens ()
1. Introduction
Newcastle disease (ND) is a highly contagious and infectious disease that affects almost all avian species including poultry, cage and wild life bird species [1] -[3] . It is widespread affecting many continents of the world namely; Asia, Africa, and America [4] and causes considerable economic losses, not only due to high flock mortality but also through the economic impact that may arise from trade restrictions and embargoes [5] [6] . It has been reported to affect other birds such as guinea fowls, quails, turkeys, pheasants and peacock [1] [6] . Mortality due to ND ranges from negligible to as high as 100% depending on the form or pathogenicity of the virus [1] .
Kudu 113, a strain of NDV isolated from apparently healthy ducks and characterized by Echeonwu et al. [7] in Nigeria, has been studied in chickens and guinea fowls [6] [8] . This strain is frequently seen in outbreaks in Nigeria [9] . Ducks and other anseriformes are suspected to have maintained the endemicity of the disease around the world [4] [10] [11] . Scanty information is available on the basic performance of ducks in Nigeria [12] [13] . There is also a paucity of information on the effects of vNDV infection on the hematology of ducks and chickens. In this article, the comparative evaluation of the effects of vNDV infection on the hematology of ducks and chickens was done.
2. Materials and Methods
2.1. Flock History
One hundred and seventy day old birds hatched the same day were obtained comprising 70 ducklings from poultry section of National Veterinary Research Institute (NVRI) Vom and 100 cockerel chicks from Zartech Hatchery. Brooding was done separately for the chicks and ducklings on deep litters under the same environmental condition. The cockerel received IBD vaccine by intraocular route at days 10 and 24 post hatch (PH). Chicks’ mash was given ad libitum to the birds from day old to 8 weeks post hatch (PH). Growers’ mash was given ad libitum also from 9 weeks PH until the end of the experiment and water was allowed free choice.
2.2. The NDV Inoculum
The vNDV strain, Kudu-113 isolated from the cloacal swab of an apparently healthy ducks in Kuru, Plateau State, biologically characterized by Echeonwu et al. [7] was used in the challenge experiment.
2.3. Experimental NDV Challenge
At six weeks of age, the chicks and ducklings were each randomly assigned into two groups of infected chicks (IC), uninfected chicks (UC) and infected ducks (ID), uninfected ducks (UD). The inoculum was reconstituted to give embryo lethal dose (ELD50) titre of 106.36 per ml. The chicks and ducks in infected groups were inoculated intramuscularly (IM) with 0.2 ml of the inoculum (infected groups). The chicks and ducks in uninfected groups received 0.2 ml of PBS IM (control groups). The infected and control groups were housed at different locations and maintained on deep litter system.
2.4. Hematology
At days 3, 6, 9, 12, 15 and 21 PI, six birds from each group were randomly selected and phlebotomy was done, through the wing vein, using sterile syringe. 3 ml of blood was collected in EDTA impregnated sample bottles for hematology.
2.4.1. Packed Cell Volume (PCV)
The PCV was determined by the haematocrit method [14] , using micro capillary tubes, micro haematocrit centrifuge and reader (Hawskey®, England). The PCV values were determined using the reader and recorded.
2.4.2. Hemoglobin Concentration (HbC)
The hemoglobin concentration (HbC) was determined by the cyanomethemoglobin method [15] . Twenty microliter of the blood sample was added to 5 ml of Drabkins hemoglobin reagent in a clean test tube and allowed to react for 20 minutes. The absorbance of the mixture was read at 540ηm wavelength against the blank reagent using a spectrophotometer. Standards were prepared, using rat blood and the wavelength determined. The HbC was calculated by multiplying the spectrophotometer reading with a calibrating factor (14.5) obtained from the absorbance and concentration of the standards.
HbC = K × Sample reading/Rat standard reading; where K is a constant (14.5).
2.4.3. Total Erythrocyte Count (TEC)
The red blood cell count (RBC) was obtained by the hemocytometer method [16] , using an improved Neubauer counting chamber (NCC) (Hawskey, England) and avian RBC diluting fluid [14] .
2.4.4. Mean Corpuscular Volume (MCV)
The results of the TEC, and PCV were used to calculate the average erythrocyte and its hemoglobin concentration, using the formula;
MCV (fL) = PCV × 10/TEC. It was used in the definition of morphologic characteristic of RBC [17] .
2.4.5. Mean Corpuscular Hemoglobin (MCH)
The results of the TEC and HbC were used to calculate the average corpuscular hemoglobin, using the formula; MCH (pg) = HbC × 10/TEC [17] .
2.4.6. Mean Corpuscular Hemoglobin Concentration (MCHC)
The results of the PCV and HbC were used to calculate the average corpuscular hemoglobin concentration, using the formula;
MCHC (g/dL) = HbC × 100/PCV [17] .
2.4.7. Total Leucocyte Count (TLC)
The TLC was done by the hemocytometer method [16] , using an improved Neubauer counting chamber (Hawskey, England) and avian white blood cell diluting fluid [14] composed of aqueous phloxine, propylene, glycol, and sodium carbamate.
2.4.8. Differential Leukocyte Counts (DLC)
The DLC was done using Leishman technique [14] . The total of 100 cells was counted, by means of DLC tally counter and the number recorded. The results of each cell type were expressed as a percentage of the TLC and converted to absolute values.
2.5. Data Analysis
The hematological values between and within groups were subjected to statistical analysis using independent sample t-test and the level of significance was determined and accepted at p ≤ 0.05 for all the results using statistical products for service and solution (SPSS) version 16.0 computer software. The mean ± standard error of mean (SEM) of the results obtained in the experiment were calculated and presented in tables and graphs.
3. Results
The results of the PCV are shown in Table 1. The haematocrit values in the infected chickens were significantly lower (p < 0.05) than those of the control on days 3 to 9 PI, whereas in the infected ducks, they were significantly lower (p < 0.05) than those of the control ducks on days 3 to 15 PI.
The results of the HbC are shown in Table 2. The infected chickens recorded significantly lower (p < 0.05) values than the control on days 3 - 15 PI while in the infected ducks, they were significantly lower (p < 0.05) than those of the control on days 3 and 9 to 15 PI. The results of the TEC are shown in Table 3. The infected chickens had significantly lower TEC (p < 0.05) than the control group on days 3, 9 - 15 PI. In the infected ducks the TEC were significantly lower (p < 0.05) than the control group on days 3 - 12 PI.
The results of the MCV are shown in Table 4. The MCV of the infected chickens were significantly higher (p < 0.05) on days 3 and 9 - 15 PI, whereas the infected ducks recorded significantly higher (p < 0.05) values than the control on days 3 and 9 PI.
The results of the MCH are shown in Table 5. The infected chickens had significantly lower MCH (p < 0.05) on day 6 PI whereas, on day 9 PI, the infected chickens presented significantly higher (p < 0.05) values than in
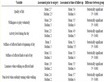
Table 1. Results of mean packed cell volume ± SEM (%).
NB* Means values significantly different at p < 0.05, Normal PCV range for birds (30.0 - 55.0).
Table 2. Results of mean hemoglobin concentration ± SEM (g/dL).
NB* Means values significantly different at p < 0.05, Normal HbC range for birds (8.0 - 13.0).
Table 3. Results of mean total erythrocyte counts (TEC) ± SEM (×106/µL).
| Days |
IC |
UC |
ID |
UD |
| 0 |
3.21 ± 0.32 |
3.21 ± 0.32 |
2.94 ± 0.21 |
2.94 ± 0.21 |
| 3 |
1.63 ± 0.03* |
2.99 ± 0.04 |
1.90 ± 0.03* |
3.19 ± 0.30 |
| 6 |
3.17 ± 0.40 |
3.07 ± 0.22 |
2.42 ± 0.12* |
2.88 ± 0.14 |
| 9 |
1.70 ± 0.09* |
2.88 ± 0.94 |
3.06 ± 0.13* |
4.45 ± 0.08 |
| 12 |
1.97 ± 0.10* |
2.84 ± 0.13 |
3.35 ± 0.09* |
3.71 ± 0.15 |
| 15 |
1.93 ± 0.08* |
2.89 ± 0.05 |
3.63 ± 0.16 |
3.41 ± 0.10 |
| 21 |
2.71 ± 0.07 |
2.82 ± 0.09 |
3.32 ± 0.80 |
3.01 ± 0.38 |
NB* Means values significantly different at p < 0.05, Normal TEC range for birds (2.8 - 4.5).
Table 4. Results of mean corpuscular volume ± SEM (fL).
| Days |
IC |
UC |
ID |
UD |
| 0 |
093.99 ± 11.18 |
093.99 ± 11.18 |
126.97 ± 06.02 |
126.97 ± 06.02 |
| 3 |
183.82 ± 15.39* |
111.44 ± 13.62 |
177.21 ± 07.73* |
130.63 ± 03.19 |
| 6 |
098.83 ± 11.98 |
111.30 ± 08.03 |
141.20 ± 11.45 |
131.35 ± 07.03 |
| 9 |
156.67 ± 03.09* |
111.70 ± 12.76 |
105.13 ± 05.52* |
079.78 ± 03.02 |
| 12 |
148.33 ± 08.71* |
107.39 ± 07.64 |
096.03 ± 04.01 |
106.93 ± 04.15 |
| 15 |
155.33 ± 07.39* |
108.41 ± 04.40 |
096.42 ± 03.89 |
109.09 ± 08.01 |
| 21 |
117.83 ± 13.10 |
111.70 ± 03.25 |
118.91 ± 06.88 |
098.61 ± 04.94 |
NB* Means values significantly different at p < 0.05, Normal MCV range for birds (100 - 130).
the control. On the other hand, the infected ducks recorded significantly higher (p < 0.05) values than the control on days 3, 9 and 21 PI and significantly lower (p < 0.05) values than the control from days 12 - 15 PI.
The results of the MCHC are shown in Table 6. The infected chickens presented lower significant (p < 0.05) values on days 6, 12 and 15 PI. In the infected ducks, the MCHC were significantly lower (p < 0.05) than the control only on day 12 PI.
The results of TLC are presented in
Figure 1. The infected chickens had significantly lower TLC (p > 0.05)
Table 5. Results of mean corpuscular hemoglobin ± SEM (pg).
NB* Means values significantly different at p < 0.05, Normal MCH range for birds (28.57 - 46.43).
Table 6. Results of mean corpuscular hemoglobin concentration ± SEM (g/L).
NB* Means values significantly different at p < 0.05, Normal MCHC (26.70 - 33.47).

Figure 1. Results of total leukocyte counts ± SEM (103/µL).
than the control from days 6 - 21 PI, while the TLC of the infected ducks presented significantly lower (p < 0.05) values than the control only on day 3 PI, but significantly higher (p < 0.05) values than the control on days 9 - 21 PI.
The average differential leukocyte counts (DLC) results are shown in Table 7. There was significantly lower (p < 0.05) heterophil counts in infected chickens than the control from days 3 PI and consistently up till day 21 PI, whereas the infected ducks had significantly higher (p < 0.05) heterophil counts than the control on days 3 - 9 PI. By the day 12 the value was significantly lower (p < 0.05) than the control, but later increased significantly higher (p < 0.05) than the control group at day 21 PI (Table 7). The lymphocyte counts were significantly lower (p < 0.05) in infected chickens than the control on days 6 and consistently remained lower up till 21 PI (
Table 7).
Table 7. Average absolute differential leukocyte counts in chickens and ducks (Mean ± SEM/µL).
H = Heterophil, L = Lymphocyte, M = Monocyte E = Eosinophil and B = Basophil, *Means values significantly different at p < 0.05.
In the infected ducks, the lymphocyte counts presented significantly lower (p < 0.05) values than the control only on day 3 PI and consistently recorded higher significant (p < 0.05) values than the control from days 6 to 21 PI (Table 7). The monocyte counts in infected chickens were significantly higher (p < 0.05) than the control only on day 3 PI, but consistently showed significantly lower (p < 0.05) values in infected than the control from days 6 to 15 PI (Table 7). In the infected ducks, there were bouts of monocytosis. The monocyte counts were significantly higher (p < 0.05) than the control from days 3 to 9 PI and 21 PI, but had significantly lower (p < 0.05) values than the control on days 12 and 15 PI (Table 7). The basophil and eosinophil counts were not consistent for both infected and control chickens and ducks (Table 7).
4. Discussion
The erythrocyte response in the chickens and ducks had varying patterns in this study, even though there was significant depression of TEC, PCV and HbC in both infected chickens and duck when compared with the controls indicating anemia [18] . Blood samples were not collected from moribund birds to forestall polycythemia attributable to hemo-concentration occasioned by reduced water intake and the associated dehydration [19] . However, the values in infected ducks were within the reference normal range for birds in our teaching hospital. The severe anemia observed in the infected chickens may likely be due to possible intravascular hemolysis and blood loss usually seen in form of proventricular hemorrhages and GI ulcers in VND [20] . The mean corpuscular values in chickens indicated that circulating RBC at those points was mainly immature red cells (reticulocytosis) with less hemoglobin better described as macrocytic hypo-chromic anemia while in the ducks, the circulating RBC at those points was mainly mature RBC with adequately saturated hemoglobin, described as macrocytic normo-chromic anemia [21] -[23] .
The variations in WBC—leukocytopenia in chickens and leucocytosis in ducks—may be due to heteropenia, lymphopenia and monocytopenia, and heterophilia, lymphocytosis and monocytosis respectively, demonstrating the marked depression and elevation reactions of the white corpuscles of chickens and ducks during ND respectively [14] . The lymphopenia recorded in chicken may be associated with depletion of lymphocytes in the bursa of Fabricus, spleen and thymus as reported by Ezema et al. [24] . Monocytopenia is a form of leukopenia associated with a deficiency of monocytes and which may be caused by acute infections, and other numerous disease syndromes [25] . The monocytes in the blood are in transit between the marrow and tissues, where they are transformed into tissue macrophages [26] . They participate virtually in all inflammatory and immune disorders such as severe viral and bacterial infections for mopping up of necrotic debris [27] .
The leukocytic alterations recorded in this study indicate that vND exert marked depression on leucogram in chickens, as reported by Calderon et al. [20] . The bone marrow may have responded to tissue damage with initial leukocytosis and heterophilia but later depressed to heteropenia as observed in this study. Heterophilia and concurrent lymphopenia are observed in viral disease of birds [28] and lymphopenia of acute infection may have complex mechanisms which include endogenous corticosterone release with temporary lymphocyte redistribution, and trapping of circulating lymphocytes within lymphoid tissue, especially, during viral infection [29] . A sequential study in chickens after vND was made by Harrison et al. [25] who detected that the virus induced programmed cell death principally in mononuclear cells—macrophages and lymphocytes. Lymphopenia is common in acute inflammatory responses, because inflammatory mediators stimulate the diapedetic migration of heterophils and lymphocytes from the blood and lymphoid tissues to the points of inflammation where they are eventually destroyed [28] . This may account for the immunosuppression previously reported in vND in chickens [24] . The monocytosis and then monocytopenia in the infected chicken and monocytosis in duck may be related to the transit period of monocytes from bone marrow to the tissues as macrophages [27] and the variations between the 2 species may be related to the extent of tissue damage [27] . Eosinophil, and basophil absolute values in both infected birds, in this study, showed no consistent and relevant changes. This is in line with previous report by Calderon et al. [20] and the basic functions of eosinophils and basophils are in parasitic infections and hypersensitivity reactions respectively [30] .
Generally, the hematology in this study showed the leucogram common in the VNDV challenged chickens and ducks as leukocytopenia and leucocytosis respectively. This may be the cause of variations in the severity of the disease in both species.