Prevalence and characteristics of polycystic ovarian syndrome in a sample of infertile Kurdish women attending IVF infertility center in maternity teaching hospital of Erbil City ()
1. INTRODUCTION
Polycystic ovarian syndrome (PCOS) is the most common gynecological endocrinopathy [1]. PCOS appears to be associated with an increased risk of metabolic aberrations, including insulin resistance and hyperinsulinism, type 2 diabetes mellitus, dyslipidemia, cardiovascular disease, and endometrial carcinoma [2].
It is commonly diagnosed in young women with anovulatory infertility, oligomenorrhea or hyperandogenic problems such as hirsutism and acne. Although associated with obesity, the syndrome is also frequently seen in women of normal body conformation [3].
Although the exact definition of PCOS has varied when described by various experts, following a Consensus conference held in Rotterdam in 2003; an internationally accepted definition has been adopted by the European Society for Human Reproduction and Embryology and American Society for Reproductive Medicine, the ESHRE/ASRM Rotterdam consensus (Rotterdam consensus) [4]. According to this consensus, two of the following three diagnostic criteria must be met to arrive at a proper diagnosis:
1) Oligo-ovulation or anovulation;
2) Hyperandrogenemia/hyperandrogenism and/or;
3) Polycystic ovaries.
Estimations of the prevalence of PCOS depend on the population being assessed, as there are ethnic differences in the clinical and biochemical features of PCOS [5].
The reported prevalence of PCOS ranges between 2.2% to 26% in various countries, depending on the recruitment method, the study population, the criteria used for its definition and the method used to define each criterion [6]. The prevalence of PCOS can be as high as 30% in women with secondary amenorrhea, 40% in women with infertility, 75% in women with oligomenorrhea and 90% in women with hirsutism [7].
This study is regarded the first to be conducted in our city to determine the prevalence and characteristics of women with PCOS using the ESHRE/ASRM Rotterdam consensus criteria in a sample of infertile Kurdish population.
2. OBJECTIVES
The primary objectives were:
To estimate the prevalence of PCOS among a sample of infertile Kurdish women attending the Infertility Care and IVF center in our teaching hospital; and
To analyze the diagnostic criteria for PCOS in this context.
The secondary objective was to evaluate and compare the demographic characteristics, clinical, biochemical and ultrasonography features of infertile women with and without PCOS.
3. MATERIALS AND METHODS
3.1. Subjects and Setting
This study was carried out on infertile women attending the Infertility Care and IVF Center in Erbil City, North Iraq, Kurdistan region. It is the single infertility center in the city and more than 3200 infertile couples have been treated. From May 1, 2007 to August 1, 2008 all infertile women attending the center seeking gynecological advice were included in the study. Women with other causes of endocrinological abnormalities such as primary hyperprolactinemia, thyroid dysfunction, Cushing’s syndrome and congenital adrenal hyperplasia were excluded from the PCOS study group.
3.2. Definitions
The diagnostic criteria used to identify the presence of PCOS were according to the criteria proposed at the Rotterdam revised consensus meeting [8]. Amenorrhea was defined as an absence of menstrual cycles for more than 6 months. Oligomenorrhea was defined as a delay in menses of >35 days to 6 months [9]. Clinical hyperandrogenism was diagnosed using a modified FerrimanGallwey score for evaluating and quantifying hirsutism in women using nine body areas (upper lip, chin, chest, upper and lower abdomen, thighs, upper and lower back and upper arm) [10]. Hair growth was rated from 0 (no growth of terminal hair) to 4 (extensive hair growth) in each of the nine locations; a score of 8 or higher was regarded as indicative of androgen excess. The presence of acne, greasy skin and thinning of hair of the scalp were also recorded, although no specific scoring systems were applied [11].
3.3. Hyperandrogenemia
This was defined as increased circulating levels of androgen. The normal range of total testosterone for women is 15 - 70 (ng/dl). A total testosterone level > 70 ng/dl was regarded as indicating hyperandrogenemia.
3.4. Overweight and Obesity
These parameters were defined according to WHO criteria as body mass index (BMI), calculated by dividing the weight in kilograms by height in meters squared. Being overweight was defined as a BMI > 25 kg/m2 and being obese as >30 kg/m2
3.5. Waist-to-Hip Ratio (WHR)
This was calculated after measuring the waist circumference between pelvic brim and costal margin, while hip circumference was taken at the level of greater trochantor. A WHR < 0.85 was considered normal, while a WHR ≥ 0.85 was regarded abnormal [12].
3.6. Ultrasonography
Transvaginal ultrasonic screening with an 8 MHz vaginal with 8 MHz vaginal transducer (PHILIPS, Model 2540, USA), was performed twice for all 320 women. The first examination was performed in the early follicular phase during ovarian quiescence for evaluating ovarian morphology. Polycystic ovaries (PCOs) were diagnosed in the case of an increased follicular count (>11 follicles, 2 - 9 mm in one or both ovaries) and/or an increased ovarian volume (>10 ml) for at least one ovary [13]. The second transvaginal ultrasound examination was done at mid-cycle for detecting mature follicles in cycles without the prior use of ovulation-inducing drugs. Follicles > 16 mm in diameter were regarded as mature.
3.7. Hormonal Analyses
Serum samples were analyzed in non stimulated tracking cycles and the following hormonal investigations were performed on all women:
Days 2-3 of the menstrual cycle: follicle stimulating hormone (FSH) and luteinizing hormone (LH) levels; Total testosterone and prolactin levels; Day 21 progesterone level.
The normal cutoff for FSH and LH was taken as <10 mIU/ml. A prolactin level < 35 ng/ml was taken as normal; a total testosterone level of <70 ng/dl was regarded as normal and a progesterone level of >20 ng/ml on day 21 was regarded as confirming ovulation.
3.8. Grouping of the Cases
The presence of PCOS features was defined using the Rotterdam (2003) criteria. The 320 women were divided into two groups: a PCOS group and a non-PCOS group.
3.9. Phenotypes
Women considered to exhibit PCOS were classified into four phenotypes:
• Phenotype A: ovulatory dysfunction + hirsutism and/ or hyperandrogenism + PCOs (full blown syndrome);
• Phenotype B: ovulatory dysfunction + hirsutism and/ or hyperandrogenism;
• Phenotype C: ovulatory dysfunction + PCOs;
• Phenotype D: hirsutism and/or hyperandrogenism + PCOs [14,15].
3.10. Study Protocol
A specially designed data collection form was prepared for recording information about each patient. This included a medical history, examination results, hormonal levels and ultrasonography findings. Patients were interviewed directly by one of the researchers.
3.11. Ethical Approval
The institutional Review Committee of Hawler Medical University, College of Medicine approved the study proposal (approval number: 17/N Date: 3/2/2008). An informed verbal consent was obtained from all participants.
3.12. Statistical Analysis
Data analysis was performed using IBM SPSS Statistics (version 15: IBM Corp., Armonk, NJ, USA). All data are reported as the means ± SD, Student t-test and Chi squared tests were used when appropriate. P < 0.05 was considered statistically significant.
4. RESULTS
There were 106 women in the PCOS group and 214 in the non-PCOS group. The prevalence of PCOS within the study population was 33%. Hyperprolactinaemia was detected in six women, and hyperthyroidism was detected in four; these women were included in the nonPCOS group.
The frequencies of PCOS phenotypes (Figure 1) were as follows:
•Phenotype A: 42%;
•Phenotype B: 24%;
•Phenotype C: 20%;
•phenotype D: 14%;
•Phenotype C: 20% of women with PCOS;

Figure 1. Distribution of women with PCOS according to phenotype.
•Phenotype D: consisting of 14% of women with PCOS.
The mean ages in the PCOS and non-PCOS groups were 29.5 ± 5.45 years versus 32.9 ± 6.95 years, respectively (P = 0.00061). Most women in the PCOS group (30.2%) were aged 25 - 29 years, while in the non-PCOS group most (24.3%) were aged 35 - 39 years .There were no statistically significant difference between the 2 groups regarding educational level, occupation or residency. There were also no significant difference between the two groups regarding any family history of infertility and obesity (Table 1).
The mean age at marriage was not significantly less in the PCOS group than in the non-PCOS group. There was primary infertility in 61.3% of women in the PCOS group versus 58.4% in the non-PCOS group; the incidences of secondary infertility were 38.7% versus 41.6% respectively; these were not significantly different. Also the duration of infertility was not less in the PCOS group than in the non-PCOS group, as listed in Table 2.
Oligomenorrhea and amenorrhea were significantly more common among the PCOS women at 74.5% and 11.3%, respectively, while in non-PCOS group the rate were 23.4% and 2.3% respectively( P = 0.000).
Women in the PCOS group had more coarse hair growth (hirsutism) than women in the non-PCOS group (P = 0.000).
Acne was not significantly more prevalent among women with PCOS than in women without PCOS: 22.6% versus 18.7% respectively (P = 0.405). There was a statistically significant difference between the two groups in reporting greasy skin and history of scalp hair loss. Women with PCOS had a higher mean BMI than women in the non-PCOS group but the difference was not significant statistically (30.9 ± 5.84 kg/m2 versus 29.9 ± 5.31 kg/m2 respectively, P = 0.571). There was no significant difference between the two groups in the incidence of obesity and being overweight. Mean WHR was significantly greater in the PCOS group (0.96 ± 0.06 versus 0.92 ± 0.06; P = 0.019) (Table 3).
The incidence of elevated LH level was significantly higher in PCOS group than in non-PCOS group (17%
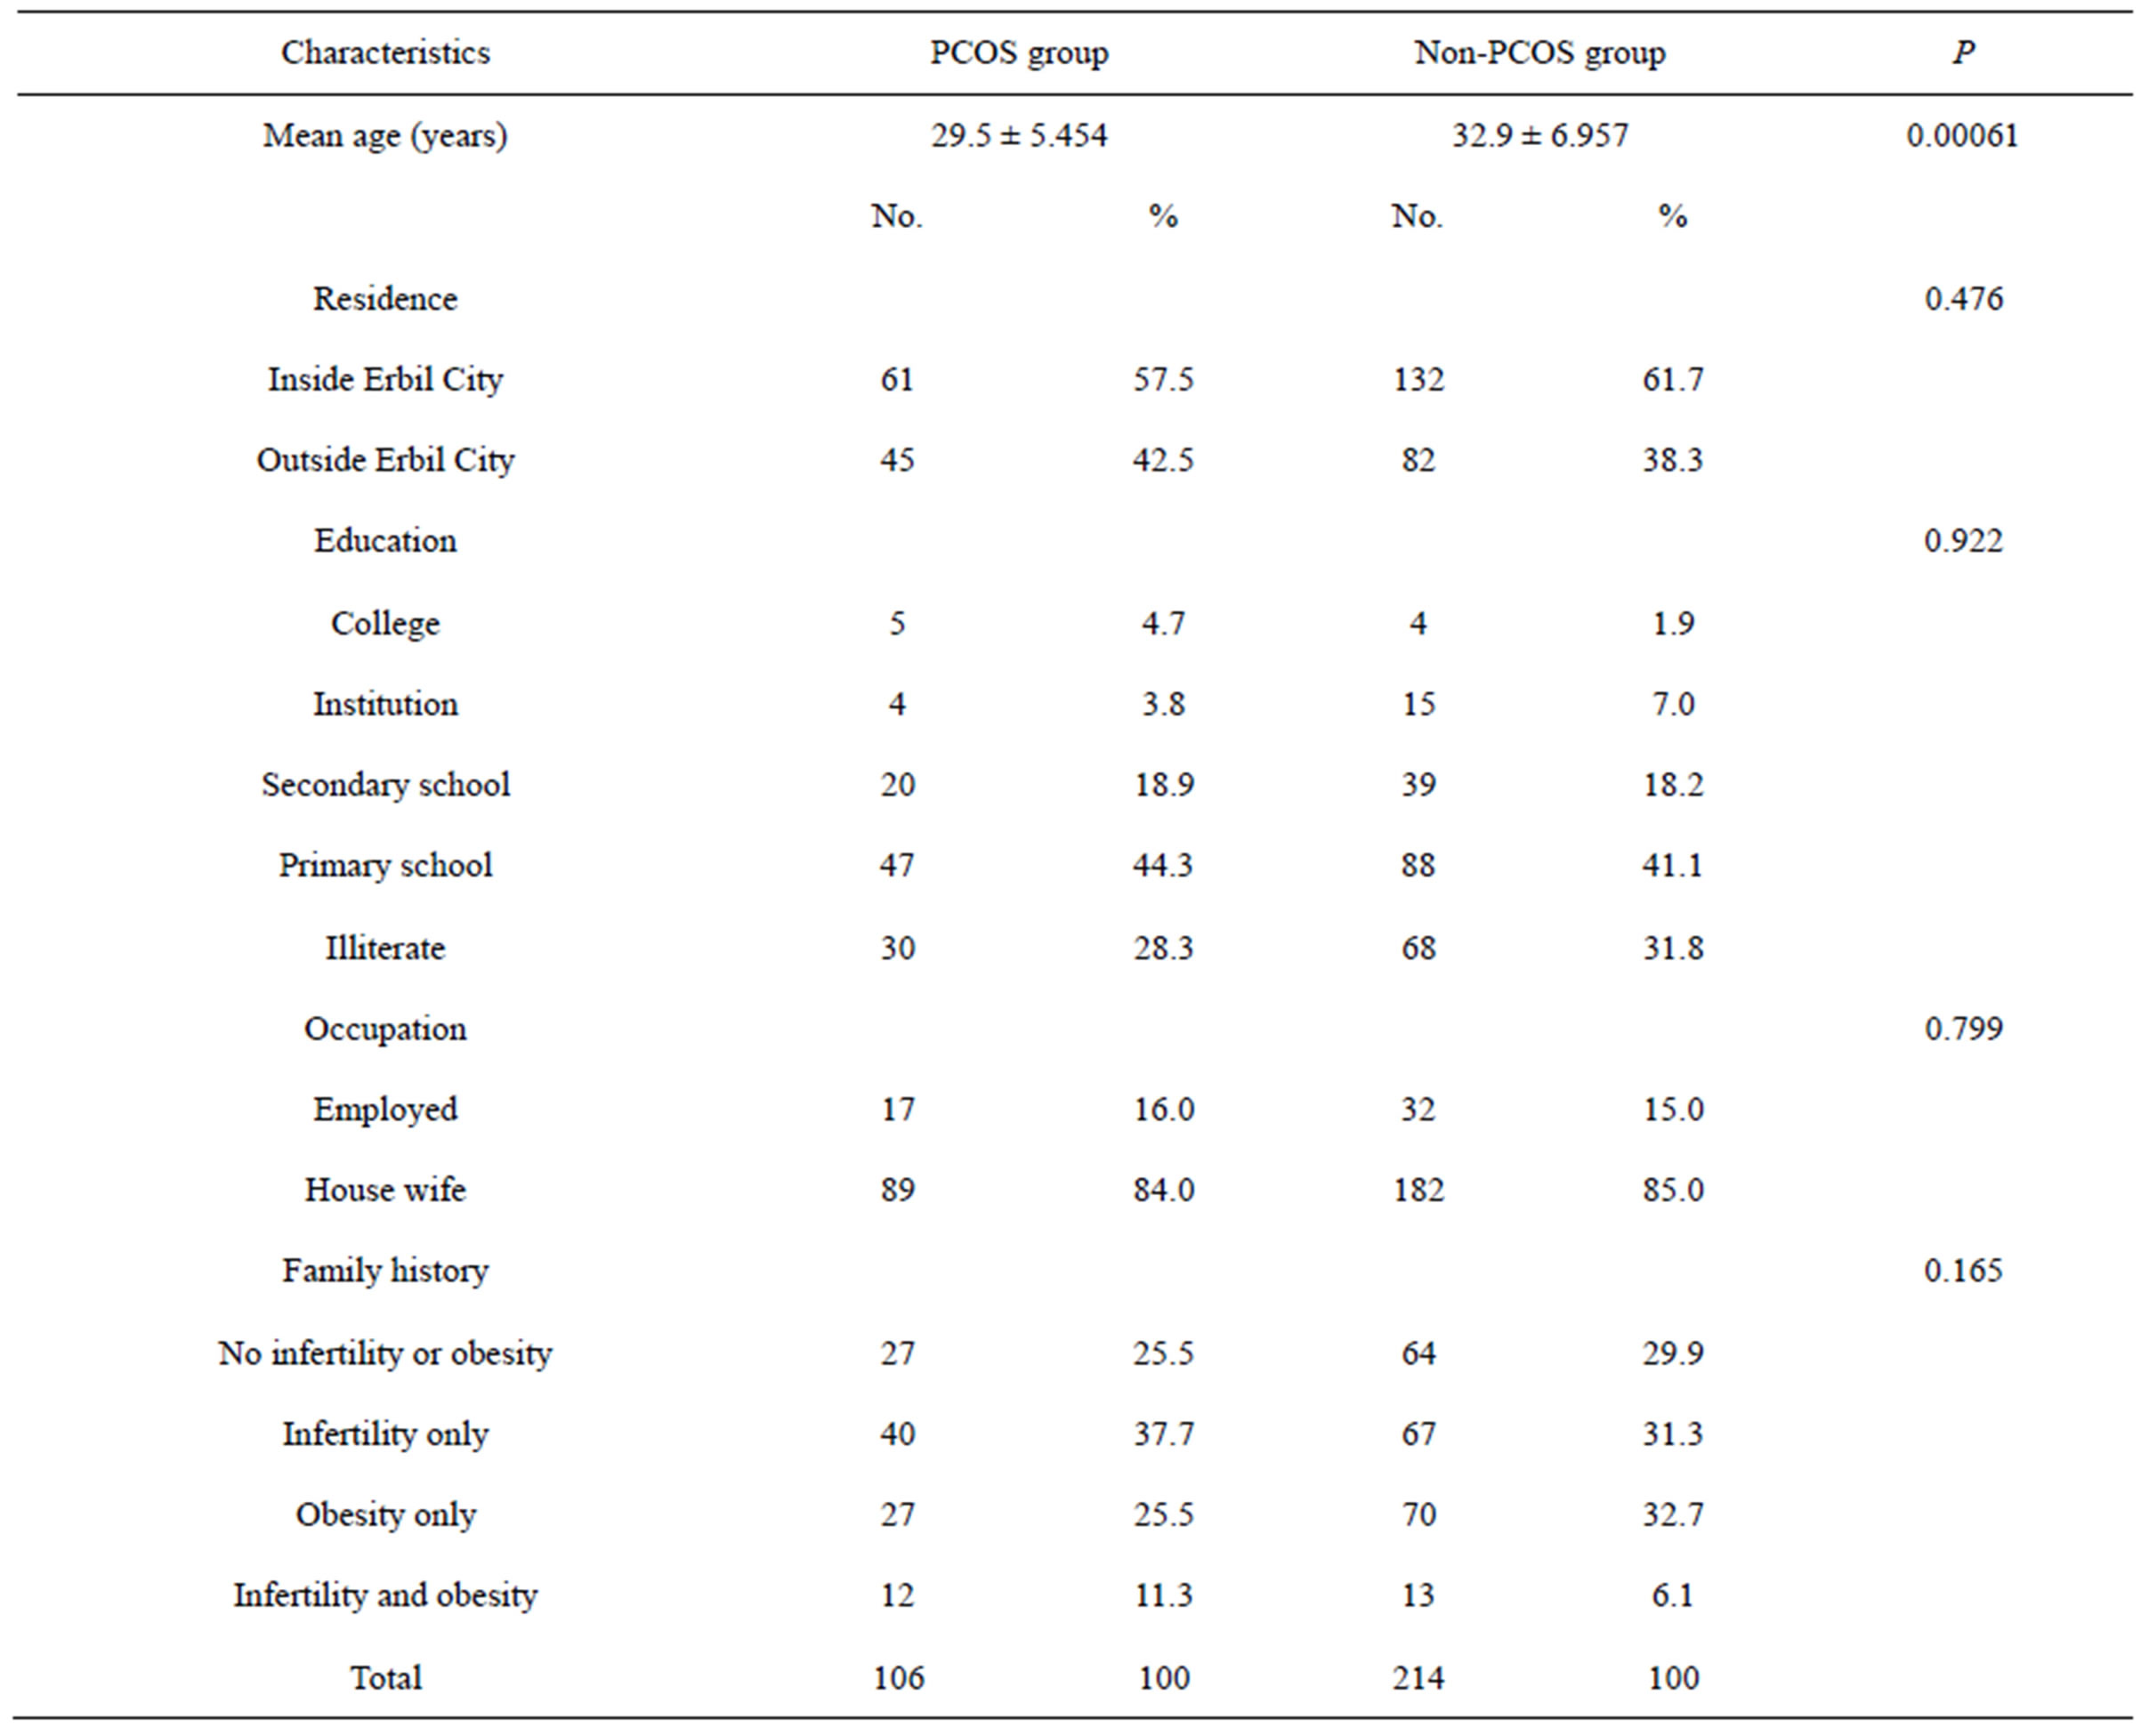
Table 1. Distribution of women according to demographic factors and family history of infertility and obesity.

Table 2. Distribution of women according to age at marriage, duration of infertility and type of infertility.

Table 3. Distribution of women in the PCOS and Non-PCOS groups according to clinical features.
versus 8.4% respectively, P = 0.000). The incidence of elevated FSH level was not significantly higher in the non-PCOS group than in the PCOS group (15% versus 10.4% respectively = 0.476). There was no statistically significant difference between the two groups in terms of the LH/FSH ratio and total testosterone level. Progesterone was measured in the mid-luteal phase to confirm ovulation and there was a statistically significant difference between the two groups; 90.7% of the non-PCOS group versus 7.5% of PCOS group showed ovulatory cycles (Table 4).
Table 5 shows the ultrasonic appearance of polycystic ovaries in both groups.