Synchronous Changes of Nitrogen and Carbon Isotopic Ratios and Nannoplankton Assemblage in Marine Sediments off Peru at 250 ka: A Role of Phytoplankton in Primary Ocean Productivity ()
1. Introduction
Chemical elements in geological environment can be found either in access or in deficit concentration levels in relation to biota and human health. Both these cases can be assessed for the certain group of chemical elements as unfavorable for humans based on their potential to cause adverse health effects. Adverse health effects can result either access or on the other hand the deficit of chemical elements, ions and essential micronutrients (e.g. iodine, selenium, zinc, magnesium, arsenic or radon).
During last year’s mainly potentially toxic elements such as As, Hg, Cd and Pb are the object of concern within medical-geochemical researches [1]. The assessment of health effects of common macro-components like Ca, Mg, SiO2, K or Na is really rare. By now, no complex research, dealing with the assessment of wide range of chemicals, macro-component as well as potential toxic elements in geological environment and their summary a mutual effect on human health has been performed. The first complex evaluation of the impact of chemical elements commonly studied during geochemical mapping on human health was realized in pilot project of regional medical-geochemical works in the Slovak Republic “Environmental and Health Indicators of the Slovak Republic” [2]. The relations between chemical elements (environmental indicators) in geological environment and health status of residents (health indicators) were studied and analyzed through the method of artificial intelligenceneural networks. This analysis was based on using of neural network as tool for analyzing potential impact of chemical elements/compounds contained in groundwater (33 chemicals) and soils (34 chemicals) on human health of the Slovak population (represented by 30 the most significant health indicators).
This paper deals with the analysis of the influence of 67 environmental indicators (33 for groundwater and 34 for soils) upon breast cancer mortality in the Slovak Republic performed by artificial intelligence—neural networks. The main aim of this work is to determine those chemical elements/compounds found in the geological environment that may have significant influence on breast cancer mortality in the Slovak Republic and to define appropriate limit (optimal—maximal permissible) concentration levels of these chemicals in the environmental components (groundwater, soils).
2. Materials
2.1. Geochemical Data—Environmental Indicators
Environmental indicators are generally the contents of chemical elements/compounds or values of geochemical parameters measured in the environment.
As environmental indicators we assess in this study contents of chemical elements/compounds and parameters in groundwater and soils. These two geological components of the environment are considered to be in very close relationship with human health. The groundwater is the most important source of drinking water. In Slovakia, it is used as the source of potable water for more than 85% of Slovak inhabitants. The soil is the base of food chain, and represents the part of the environment where whole human life takes place directly and with which human population is in direct contact through incidental ingestion. The soils as well as the groundwater chemical contents are determined as “total contents” (way of digestion and methods of sample analysis according to [3, 4]).
The basis for the compilation of datasets for environmental indicators of the Slovak Republic was environmental-geochemical mapping programme (Geochemical atlases, environmental-geochemical maps) going from the nineties and continuing until present [2].
Total number of geochemical data was 20,040 chemical analyses in case of groundwater and 9860 chemical analyses in case of soils. Chemical analyses comprised in dataset are dated from 1991 when modern stage of environmental-geochemical mapping in accordance with IGCP 360 Geochemical Correlation Programme [5] has begun in the Slovak Republic. Sampling density for groundwater was about 1 sample per 2.5 km2 and for soils 1 sample per 5 km2.
The set of evaluated environmental indicators with respective mean values for the Slovak Republic is reviewed in Table 1.
Environmental indicators (contents of chemical elements/compounds) were elaborated in the form of mean values for each administrative unit of the Slovak Republic (municipality, district, regions).
They way of calculation was following. Based on all input data the map of surface distribution of chemical contents for both analyzed media was compiled in the form of pixel map. MapInfo Professional 9.0 was used as software tool. Searching factor was 1, function power 2 and anisotropy was not taken into account. The basic cell of map is represented by so-called pixel, square with side representing 1 km (pixel surface 1 km2). For each pixel corresponding mean value of chemical concentration was calculated by model of inverse distance from the pixel center to the nearest 10 samples. In the next step interpolated contents were smoothed by method of moving median based on the values of 9 neighboring pixels. The value of grid mean of environmental indicators for respective administrative units (municipality, district, and region) was subsequently calculated as arithmetic mean from the content values of those pixels falling into corresponding administrative unit. The values of those pixels that intersect administrative unit partially were also taken into account. This way of calculation applied for environmental indicators provides suitable tool for more objective evaluation of chemical contents in studied administrative units since it takes into account their distribution regardless of the administrative boundaries and give the data interpolation also outside these boundaries. The results of performed calculations of environmental indicators were elaborated in table form as well as figured in the form of maps for about 2900 municipalities, 79 districts, 8 regions and whole territory of the Slovak Republic.
The example of final interpretation of environmental indicator for the Slovak Republic is shown in Figure 1 for pHKCl—the most influential environmental indicator in relation to breast cancer mortality. Other environmental indicators are available online at www.geology.sk/geohealth/.
2.2. Relative Mortality from Breast Cancer (C50)
Breast cancer mortality depends on series of risk factors [7-15]. Among the most frequently introduced risk factors belong: genetic predispositions, ageing, overweight and diet in general, regular smoking and drinking of alcohol, cancer in family, childlessness or late first childbirth and treatment or diagnostics via ionizing radiation and of course environmental factors. From the environ-
Table 1. Characteristics of environmental indicators for the Slovak Republic (mean value), according to [2].

Note: Data except of pH in mg·l−1, macro-components in %, micro-components in mg·kg−1, IER—index of environmental risk according to [6].

Figure 1. Mean values of pHKCl in soils for municipalities of the Slovak Republic.
mental indicators that have influence on breast cancer (and cancer in general) the most frequently mentioned include organic pollutants (e.g. DDT, PCB), further common anthropogenic contaminants (such as NO3) and potentially toxic elements (e.g. As, Cd, Pb). The latest clinical studies indicate that breast cancer (but also other carcinogenic diseases like cancer of prostate, digestive tract) could be associated partially also to the contents of macro-components in human tissues and fluids, mainly Ca and Mg [16-19]. The mortality from breast cancer is rather rough parameter, depending strongly on early diagnostics and effectiveness of administered therapy. The incidence of the breast cancer disease seems to be more appropriate parameter to be used. Unfortunately, these data are not available for the Slovak Republic in existing registries.
Calculation of relative mortality from breast cancer was based on data of causes of deaths collected by Statistical Office of the Slovak Republic and Czechoslovakia (ŠÚ SR, SZÚ ČSSR). The data used were recorded in the period of 1986-2008, except of the year 1992 for which no data were available. This lack of data was probably caused by the division of agenda during splitting of Czechoslovakia in the 1992 into two separate states, the Slovak and the Czech Republics.
According to International Classification of Diseases (ICD), the 9th revision, until the year 1993 the breast cancer was labeled as the diagnosis under the numbers 174 or 175 for females and males, respectively. Since the year 1994, according to 10th revision of ICD, the breast cancer has been indexed with the code C50 without reference to sex [20]. Annually, in the Slovak Republic about 15 males die from the breast cancer. The number of males in comparison with females is minimal. The breast cancer is dominantly female diagnosis. In this study we take into account all cases of deaths from the breast cancer for all population without the female/male reference. The integration of males into the calculations was performed because the territory of the Slovak Republic (with about 5.5 million of the inhabitants) is fragmented in high number of small municipalities. By the division of residents according to sex (females/males) the size of population in municipalities would decrease to a half and the resulting values would be much more variable and difficult to interpret.
Relative value for the breast cancer mortality is calculated as number of deaths from breast cancer of female and male divided by number of person-years and multiplied by 100,000 inhabitants. The number of cases of deaths from the breast cancer represents the sum of all cases of deaths for the evaluated diagnosis, recorded by Statistical Office of the Slovak (Czechoslovak) Republic within the monitoring of death causes in the period of years 1986-2008 (except of the year 1992).
The number of person-years is defined as the sum of all residents in each municipality by 31st December of the related year. It varies every year since people are born, dying and moving and that is why it is not a simple number of residents. The number of person-years represents the basis that the value of relative mortality is related to. The evaluated diagnosis is well recognized only after one hundred thousand-fold increase—recalculated for 100,000 inhabitants. The calculation was performed for each municipality with attributed statistical code for the evaluated period of years (1986-2008). In case of municipalities that were united or divided, conjunct calculation for the whole period was made (22 years) and the result was attributed to each of united or divided municipality. All together, the analysis of relative mortality from the breast cancer comprises 2883 studied municipalities. Military districts, where values of health indicators are skewed, were discarded.
In the Slovak Republic, mean value of relative mortality from breast cancer from the 1986 to 2008 is 11.52 deaths per 100,000 inhabitants. The distribution of relative mortality from breast cancer in the Slovak municipalities for the evaluated period is shown in Figure 2. The best value for relative mortality is zero; it means no deaths from the breast cancer in evaluated 22 years are documented. These municipalities are brightly shaded in the map (Figure 2). There are 766 municipalities with zero values in the Slovak Republic. These municipalities have usually low number of residents. The most numerous group (defined according to percentile values) represents municipalities with the value of relative mortality from breast cancer (RMBC) within the range of 10.80 - 16.68 (all together 721 municipalities). This range comprises also the mean value of deaths from the breast cancer defined for the Slovak Republic at the level of 11.52 deaths per 100,000 inhabitants. All together relative mortality above 100 cases of death was identified only in 4 municipalities of Slovak Republic.
3. Methods
Mathematical apparatus used for the analysis of relationship between the environment and mortality from the breast cancer was the neural network that was performed in statistical analysis software STATISTICA 7, Neural Network.
The training neural network refers to artificial intelligence and its methodology is rather complex and difficult [21]. In a few words, the most preferred inter-connections between relative mortality from the breast cancer and the values of environmental indicators are searched. In this case, 67-dimensional model was used. Each following neural network is better as the previous one due to the improvement in learning phase—it was “trained”—until the best result is achieved. The last network inevitably does not have to be the best and technically advanced. The best one can be also one of the preceding networks. That is why many neural networks have to be calculated to identify the optimum solution. The quality of found connections is reciprocally tested by the regressive modeling of RMBC in evaluated units—municipalities only for some selected environmental indicators and modeling of the function of inter-connection between mortality and indicators.
The analysis through neural network was used to identify the environmental indicators that have high rate of influence (influential) and those which are not influential. The function of relationship between the selected environmental indicators and the RMBC is defined, as well. After all this resume of the information is reflected in correlation coefficient of the network. Because 196,044 final input data in the network have origin in several tens

Figure 2. Relative mortality from the breast cancer in the years 1986-2008 in municipalities of the Slovak Republic.
of millions of primary data the final correlation coefficient reaches inevitably quite low value. It doesn’t mean that such low correlation coefficient is insignificant since 200 neural networks were calculated. The system has chosen as optimal the network with rather low correlation coefficient (0.206) and this network we have subsequently evaluated. Low coefficient may reflect the inadequacy of selected network for some cases (municipalities or environmental indicators) or it may indicate that the environment is not decisive factor for breast cancer genesis. The first presumption seems to be correct. The influence of the environment is most likely inhibited by the effect of other factors (socioeconomic, genetic and others). The final output of the calculations of neural networks is the definition of limit values (optimum, risk) for the most significant environmental indicators, performed as a function of environmental indicators and RMBC from non-linear regression in 67 dimensional space. The Slovak mean for RMBC 11. 52 was used as the boundary value.
4. Results
200 neural networks were calculated and the 198th network was selected as the optimal one with the value of correlation coefficient 0.206. Some other health indicators evaluated in similar way at national level showed much higher correlation coefficients (maximum 0.621 for crude mortality of males, [2]). Various levels of correlation coefficients documented for several health indicators confirm their different inter-connection and dependence on water and soil quality. According to WHO declaration human health state depends mainly on lifestyle and occupation (about 50%), genetic factors and health care (10% - 20%) and the environment (20%). From the point of view of generally declared 20% influence of the environment on human health state (by WHO) the calculated correlation coefficient can be characterized as very significant. We assume higher influence of the surrounding environment (water, soils) on the breast cancer incidence than is currently supposed or expected.
From 67 evaluated environmental indicators, 12 of them were identified as influential and are reviewed in Table 2 together with the function description and proposal of limit concentrations. There are also reviewed mean values of influential environmental indicators for the Slovak Republic together with respective Slovak national limit values (provided they exist).
Environmental indicators associated to RMBC were divided according to their influence into three groups. Following indicators were defined as those with the highest influence (rate of influence > 1.0) on RMBC:
Soil: pHKCl, Ce, Mg, carbonates, Na, Ca, Co and Sr.
Groundwater: Ba, SiO2, Zn, Fe.
The environmental indicators with insignificant influence on RMBC (rate of influence > 0.9 < 1.0) include following elements:
Soil: F, P, Be, V, Fe, Al, K.
Groundwater: Sr, Se, PO4, CODMn, HCO3, SO4, NO3, Na, Ca + Mg, T.D.S., Mg, Cl.
Table 2. Environmental elements with significant influence on the breast cancer genesis.
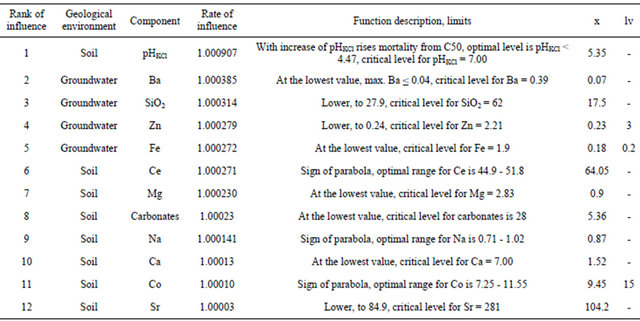
Note: x: mean values for Slovak Republic according to [2], lv: limit value for drinking water [22] and soil [23], -: not limited, element contents as in Table 1.
The other environmental indicators were characterized as non-influential in relation to RMBC (rate of influence < 0.9)
The next significant step was the determination of limit values for the elements with high influence on RMBC. The definition of limit or optimum values is clearly figured in Figure 3.
From the 12 environmental indicators with the highest influence on RMBC from 9 indicators (except of Ce, Co and Na in soils) the lowest levels were derived as the optimum values. The limit (critical) contents are those contents exceeding Slovak mean for RMBC—11.52.
For pHKCl (in the left part of curve the sign of parabola) it was still possible to define optimum contents (3.63 - 4.47). In case of Ce, Co and Na in soils only optimum contents were defined. Critical (limit) contents were not determined since model curve did not intersect the mean value for RMBC.
In next steps several true-false tests were realized to verification of model calculations and for comparison of model with real situation. First, the comparison of calculated RMBC with real values of RMBC according to agglomeration size was performed. The agglomerations were divided according to number of inhabitants into 9 groups. The results are figured on Figure 4. From this figure the entire compliance of real and model situation is evident, mainly in the case municipalities of medium size with the number of the inhabitants 3000 - 50,000 where more than a half of total Slovak population lives. For small municipalities (up to 500 residents) the real status is better than the model one and in the case of big cities (with more than 50,000) the real situation is slightly worse than the model situation. We assume that in the big cities probably much more stress factors (mainly socio-economic factor) and risk of RMBC from other than environmental reason is higher. In small agglomerations—rural settlements the quality of the environment is probably better and the stress factors of the socio-economic character act to a lesser extent.
The most relevant test of accuracy of calculations provided by the neural networks is assumed to be the comparison of calculated values of RMBC and environmental indicators with the real values. The comparison of model and real level of RMBC in dependence on the most significant environmental indicator—pHKCl is figured on Figure 5. The municipalities are divided uniformly into 6 groups (16.66% of municipalities, 481 municipalities) ac-cording to the values of pHKCl. The substantial compliance of reality and model situation is evident. Half of municipalities located in strongly to medium acid soils have much lower RMBC values than the second one situated on slight acid to alkaline soils. The municipalities with neutral to alkaline soils have significantly higher level of RMBC (approximately twofold higher than those with acid soils). We give an example of comparison of RMBC values for 5 municipalities with the most acid soils and 5 municipalities with the most alkaline soils. For the municipalities situated on the most acid soils (mean value pHKCl—3.12) the value of RMBC is 7.55 deaths per 100 000 inhabitants and for the municipalities located on the most alkaline soils (mean pHKCl—8.03) the value of RMBC is nearly two-fold—14.44 cases per

Figure 3. Breast cancer vs. Zn, SiO2, pHKCl, carbonates, Sr, Ce, Na, Ca, Mg.
100,000 inhabitants.
The comparison of different levels of RMBC for real and model situation in dependence on meeting our calculated limits for 12 environmental indicators with the highest influence is given on Figure 6. In reality as well as in model calculations the level of RMBC significantly decreases with increasing number of execution of our calculated limits. Every executed environmental limit number of deaths per 100,000 inhabitants decreases in reality of 0.79 cases and in model of 0.58 cases. It means that real status is still more connected to environment than the model one. Further, for all municipalities we have realized retrogressive tests (ANOVA) for values of RMBC and calculated environmental limits in case of 12

Figure 4. Relative mortality from C50 in association with population size in municipalities.
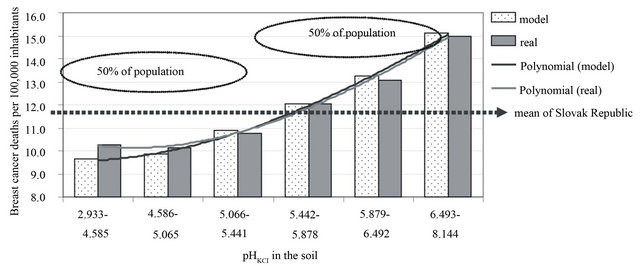
Figure 5. pHKCl in soil and relative mortality from C50.
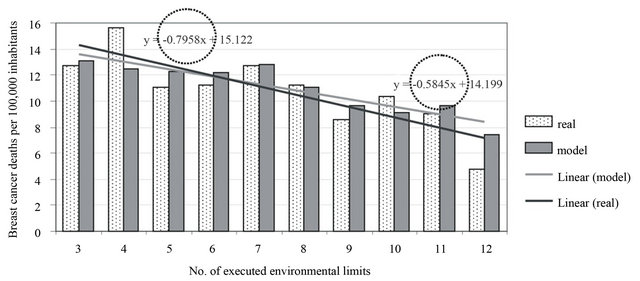
Figure 6. Number of executed environmental limits and relative mortality from C50.
environmental indicators with the highest influence. The results are given on Figure 7. Based on these tests significant differences in RMBC between municipalities where were or were not executed proposed limits were noticed in 6 environmental indicators: for soils pHKCl, Mg, Ca, Sr and for groundwater—Zn and Ba. The rest six environmental indicators did not show statistically proven difference. These environmental limits probably have influence only in lower number of municipalities and maybe this is only stochastic dependency. But the first 6 environmental indicators are clearly associated to RMBC. Proposed environmental limits seem definitely to play an important role in breast cancer mortality occurrence RMBC. Proposed environmental limits seem definitely to play an important role in breast cancer mortality occurrence.

Figure 7. Differences in mortality from C50 with environmental limit compliance execution.
5. Discussion
5.1. Linking of Environmental and Health Data
The data on environmental indicators and data of RMBC analyzed in our study have been retrieved from the official archive national datasets. These data result from the continuing collection of information, in accordance with the internationally accepted methodology which was performed by specialized state institutes—Statistical Office of the Slovak Republic and State Geological Institute of DionyzStur (Geological Survey of the Slovak Republic). The data analysis and evaluation were based on professional databases and professional statistical software. This study represents the approach of how these data can be used and analyzed in mutual interconnection. We have performed simple analysis of the relationship between the environmental indicators and the relative mortality from the breast cancer. The mean values for 67 environmental indicators and for the relative mortality from C50 were calculated according to the presented methodology for 2883 Slovak municipalities. These data represented the input parameters for trained neural network. The best one indicates that 55 environmental indicators do not influence significantly the breast cancer mortality. On the other hand 12 environmental indicators were revealed to be influential in relation to the cancer type evaluated. These are the following, sorted in descending order: pHKCl in soil, Ba, SiO2, Zn and Fe in groundwater and Ce, Mg, carbonates, Na, Ca, Co and Sr in soils. For all of them, the function equations for characterization of their relationship with the relative mortality from the breast cancer were described. Ce, Na and Co show signs of parabola—it means the optimal concentration range is required or probably necessary. For other environmental indicators identified as influential we observe the linear function that reflects the presence of the lowest concentration levels at the lowest mortality rate (“the less, the better”).
5.2. Test Accuracy Model
Based on the test accuracy of the model we can conclude these 12 environmental indicators can be appropriately used to approach the real mortality from the breast cancer in specific municipality except of those very small units (less than 100 residents). For these the results are overestimated due to error of small numbers. In addition the results obtained for the large municipalities (big cities with more than 50,000 residents) are not very precise, too. Big cities are characterized with very low possibility to identify the food sources, the origin of which is assumed probably not to be of local production (if there is any). Therefore the influence of the local contamination of soil on human health is quite difficult to prove, maybe would be more possible to carry out in a case of groundwater used as source of drinking water. Both uncertainties documented for small as well as large municipalities confirm the results of modeling.
Presented mathematical modeling enables the estimation of the limit concentration levels of environmental indicators—the values at which the mortality rate from analyzed diagnosis does not increase but shows decreasing trend or it is at least stagnant. Critical levels of the environmental indicators were defined as the values exceeding long-term Slovak mean mortality rate from C50.
The differences in real and model values of mortality in municipalities where proposed environmental limits were or were not met, were documented for 6 environmental indicators (pHKCl in soil, Ba and Zn in groundwater, Ca and Sr in soil). Lower values for real as well as model mortality were documented in all municipalities where the environmental limits were met. In addition each environmental limit met has decreased rate of mortality from the breast cancer (0.79 cases per 100,000 inhabitants in case of real mortality). It means we have documented differences between the municipalities due to the number of environmental limits met.
Among the 12 most influential environmental indicators, Zn and Ba are generally referred in the world literature [1,24,25] as to have adverse health effects but only at the significantly increased levels of their contents. Zinc is usually not assessed as single element but it is mostly integrated in the assessment of a group of potentially toxic elements (mainly Pb, Cd, As and the others). It is defined as the essential trace element that is necessary for living organisms at certain concentration level. For barium, the most common adverse effects described in the world literature are associated with the occurrence of cardiovascular diseases [26-28].
5.3. Causality of Elements
Chemical elements related to the health state of the resident population were divided in 3 groups, causal and indicative elements and elements without known effect so far [2,29]. The causal chemical elements are those with well demonstrated relationship to human health supported by a number of case studies. These are common contaminants of the environment, including mainly potentially toxic elements (As, Cd, Sb, Pb, NO3, NH4 and others). The indicative chemical elements are defined as the elements with still not proven or well described relationship to human health by case studies. However, they show statistically significant stochastic relationship to health indicators related mainly to their geochemical association to causal elements. The effect of the indicative elements is still not clear and well defined. They accompany causal elements and act as their carriers. If the indicative elements do not occur, probably the increased concentrations of the causal elements will not occur, too. Consequently the accompanying factor that may often vary locally will not act.
Among the elements without known health effects so far we include those elements which causal or indicative character was not proven and for which we do not observe any significant statistical relationship with health indicators. In case of the Slovak Republic these are mainly chemical elements occurring in low concentration levels without notable health effects.
From the 12 environmental indicators that we have defined as the most influential in this study in relation to RMBC occurrence we characterize Ca, Mg, carbonates as causal elements and pHKCl, Ba, Sr and SiO2 as indicative elements.
The increased daily intakes of Ca and Mg by humans are in world literature often associated with the increased occurrence of cancer diseases, mainly cancer of prostate, breast cancer, lung cancer, cancer of ovaries etc. [19, 30- 34]. High contents of Ca and Mg in geological environment probably significantly contribute to daily intake of Ca and Mg by human organism and subsequently they can influence in this way increased occurrence of cancer diseases. This fact must be confirmed by further studies also in other countries in the world.
Indicative character of Ba, Sr in relation to RMBC occurrence is conditioned by geochemical relations of these elements with Ca and Mg. Also pHKCl is nearly fully dependent on contents of Ca and Mg in sorption complex of soils. Indicative character of SiO2 in groundwater probably goes with inverse relationship of Ca and Mg contents. In our case for RMBC more favorable are lower contents.
6. Conclusion
Presented study deals with the analysis of the relationship between the environmental indicators for soil and groundwater and the relative mortality from the breast cancer in the Slovak Republic. Since the primary data were averaged and processed in certain way, the results are not absolutely precise and include some hidden errors and uncertainties. In addition the methodology of the used mathematical model of calculations is quite open and the calculations of others several thousands of neural networks could bring different results. Thus the input as well as the output can be rather inaccurate. However, the study is based on huge datasets, professional analytical approaches included and the results are very conclusive.
It is rather difficult to comment the execution of the proposed environmental standards. The natural, environmental conditions are to the great extent independent and not so easy modified, if ever, by humans. The term “environmental limit” and its compliance or not is therefore only very simple way how to assess the relationships within such a complex system as the nature/environment in relation to human health. In addition to the natural contamination there is the anthropogenic contamination of the environment and the anthropogenic input of artificial substances, performed in many cases with good intentions (e.g. fertilization).
The most striking finding of this study was that the relative mortality from the breast cancer is influenced mainly by the carbonatic character of the environment (pHKCl, Ca, Mg, carbonates in soils) more than the commonly assumed carcinogenic chemicals (e.g. As, Cd, NO3).
It is impossible to give objective definition of causal relations for the environmental indicators defined in this study as influential in relation to the breast cancer mortality. Maybe their relationships can only be stochastic. A series of case studies must be performed to clearly demonstrate the relationship of carbonate contents in the environment and cancer disease occurrence. This work may be the initiative for further researchers. We assume its importance also from the methodological point of view. It has been demonstrated that the application of the artificial intelligence—neural network can be helpful for the identification of the potential impact of chemical elements found in geological environment also on other diagnoses and incidence of other type of diseases. An example of such relationship can be the impact of deficit concentrations of calcium and magnesium in soils and groundwater in the environment built up of silicate Neogene volcanic rocks found in the Slovak Republic on increased incidence of cardiovascular diseases of resident population. The mortality of resident population due to cardiovascular diseases in this environment is found to be two fold higher in comparison with national Slovak average values [2].
7. Acknowledgements
This research has been performed within the project LIFE10 ENV/SK/000086. The impact of geological environment on health status of residents of the Slovak Republic “that is financially supported by the EU’s funding instrument for the environment—Life + programme”.
NOTES