Smoothed Empirical Likelihood Inference for ROC Curves with Missing Data ()
1. Introduction
The receiver operating characteristic (ROC) curve has been extensively used to evaluate the diagnostic tests. The ROC curve is usually defined as a graphical plot of the sensitivity vs (1-specificity). It is clear that ROC curve is an appealing method to summarize the accuracy of predictions in the diagnostic test. In recent years, ROC curves have been widely applied to medical research, diagnostic medicine and many other scientific research fields (Zhou, McClish and Obuchowski [1], Pepe [2]).
Empirical likelihood (EL) is a useful nonparametric statistical inference method which does not need to assume a known family of distributions (see Owen [3]). Owen [4,5] originally proposed EL confidence regions for the population mean parameter in the complete data setting. Chen and Hall [6] introduced smoothed EL confidence intervals for quantiles. To improve the performance of normal approximation methods for the ROC curve for small sample sizes, the EL based method has been used to estimate the ROC curve. Claeskens, Jing, Peng and Zhou [7] developed smoothing EL confidence intervals for ROC curves and Su et al. [8] proposed plug-in EL for the ROC curve. Liang and Zhou [9] developed semi-parametric EL confidence intervals for ROC curves with right censoring.
In recent years, missing data problem received much attention in biomedical studies, population survey andmany other related fields. Some of the responses may not be obtained due to information loss (see Qin and Qian [10], Wang and Rao [11]). There is no inference procedure about the ROC curve with missing data. Recently Qin and Qian [10] proposed smoothing EL interval estimation for the difference of two quantiles with missing data. Motivated by their idea, we propose empirical likelihood ratio for the ROC curve with missing data and prove that the resulting EL ratio has a scaled chi-squared limiting distribution. This approach is a natural extension of Claeskens et al. [7] to missing data.
The rest of the paper is organized as follows. In Section 2, adopting Qin and Qian [10]’s approach, which was also from Claeskens et al. [7], we propose the smoothed empirical likelihood ratio statistic, derive its limitingdistribution and construct the empirical likelihood confidence interval for the ROC curve. In Section 3, we conduct a simulation study to evaluate the finite sample performance of the empirical likelihood interval estimation. The conclusion is given in Section 4. The proofs are given in the Appendix.
2. Main Results
In the following, we adopt the same notations and terminologies as those in Qin and Qian [10]. Suppose there are two independent populations  and
and , where
 , if x is missing,
  , otherwise;
 , if y is missing,
  , otherwise. We assume that x, y are missing completely at random, i.e.,
  and
and . We consider i.i.d. samples of missing data
 ;
;
 . Let
. Let ,
,  , mx = m – rx and
 . Qin and Qian [10] use
  and
and  to denote the sets of respondents with respect to x and y, and use
  and
and  to denote the sets of non-respondents, respectively. Like Qin and Qian [10], we let
  and
and  be the imputed values for the missing data with respect to x and y. Use random hot deck imputation to select a
  for some
  (Little and Rubin [12]). Similarly, we obtain
 . One can obtain complete data as follows.

It is of interest to study two populations, one with disease and another one with non-disease. Suppose that the distribution function of disease population X is F(t) and the distribution function of non-disease population Y is G(t). The sensitivity and specificity for a continuous-scale diagnostic test are 1-F(t) and G(t) at a threshold t. At a given level , the ROC curve is expressed as
where . As Qin and Qian [10], let the bandwidth
 as
as ,
,  as
as , and the kernel functions
  and
and . Define

We adopt the smoothed EL approach of Qin and Qian [10] and define the profile EL ratio statistic at :
:
where

and ,
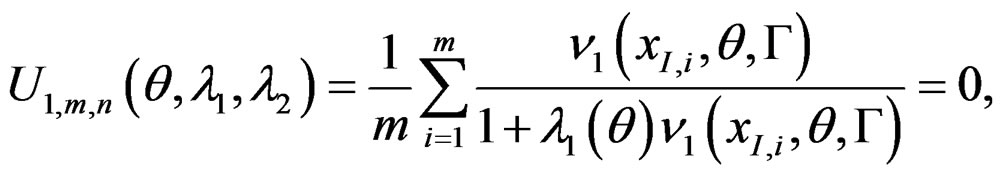
,  satisfy the following equations:


and


We set . By using the Lagrange multipliers method, we have that

where , and
, and  satisfy the following score equations:


where

and
 .
.
Suppose that  is the true value of
 .In this paper, we assume the same regularity conditions (i)-(v) in Qin and Qian [10] with condition (ii) modified as follows:
(ii) Denote  and
and . For some
 , suppose that
  and
and  exist and are uniformly continuous and bounded in a neighborhood of
 . Assume that
 .
.
Recall that condition (iii): n/m → k as m + n → ∞. Then we state the main result about confidence intervals for the ROC curve.
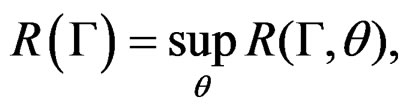
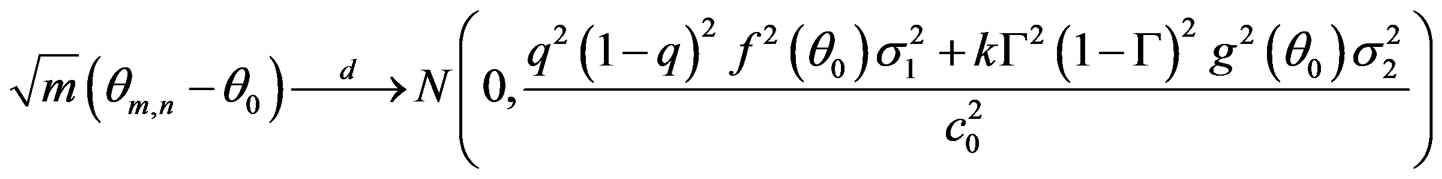
Theorem 1. Under the regularity conditions (i)-(v), as m + n→∞, there exists a root  of Equation (1) such that
  attains its local maximum at
 ,
,

where

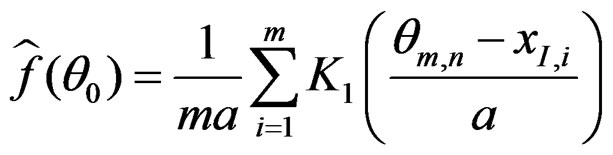
We know that k is estimated by n/m, and  and
and  can be consistently estimated by

respectively. Qin and Qian [10] showed that,

are consistent estimators of  and
and . Put
. Put

Plugging in the above consistent estimators, we obtain a consistent estimator  of
of . Let
. Let  be the upper
  -quantile of
 . Thus, it follows from Theorem 1 that the
  EL confidence interval for
  is given by

Remark: The asymptotic distribution of the EL statistic is a standard  distribution for complete data since
  and it coincides with the conclusion of Claeskens et al. (2003).
3. Simulation Studies
In this section, we carry out extensive simulation studies to evaluate the performance of the EL method for the ROC curve in terms of coverage probability and average length of confidence intervals with different response rates and sample sizes.
The simulation setting is similar to Qin and Qian [10]. The diseased population X is distributed as , while the non-diseased population Y follows
 . We choose kernel function
and the bandwidths ,
, . We draw random samples x and y from the populations X and Y.
The response rates for x and y are chosen as 
 . The sample sizes are chosen to be
 . We generate 1000 random samples of the data. The proposed EL confidence intervals for the ROC curve are constructed at q = 0.1, 0.3, 0.5, and 0.7. The nominal level of the confidence intervals is selected as
 .
.
From Tables 1-4 we have the following findings:
1) Note the response rate is higher and larger than 0.6 in the simulation study. For each fixed response rate and sample size, the coverage probability of confidence intervals for the ROC curve is close to the nominal level 95%. In the simulation, when sample size is small, the coverage probability is still good.
2) For almost all the cases in the simulation study, when the response rates increase, the coverage probabilities of confidence intervals are closer to 95%, i.e., they are more accurate, and the average length of the confidence intervals decreases, because larger response rates provide more information for the data.
3) Similarly, when the sample sizes increase, the coverage probabilities of confidence intervals are more accurate, and the average length of the confidence intervals decreases.
4) For different q = 0.1, 0.3, 0.5, and 0.7, the EL confidence intervals maintain good coverage probability, and it is very stable.

Table 1. Empirical likelihood confidence intervals for the ROC curve at 
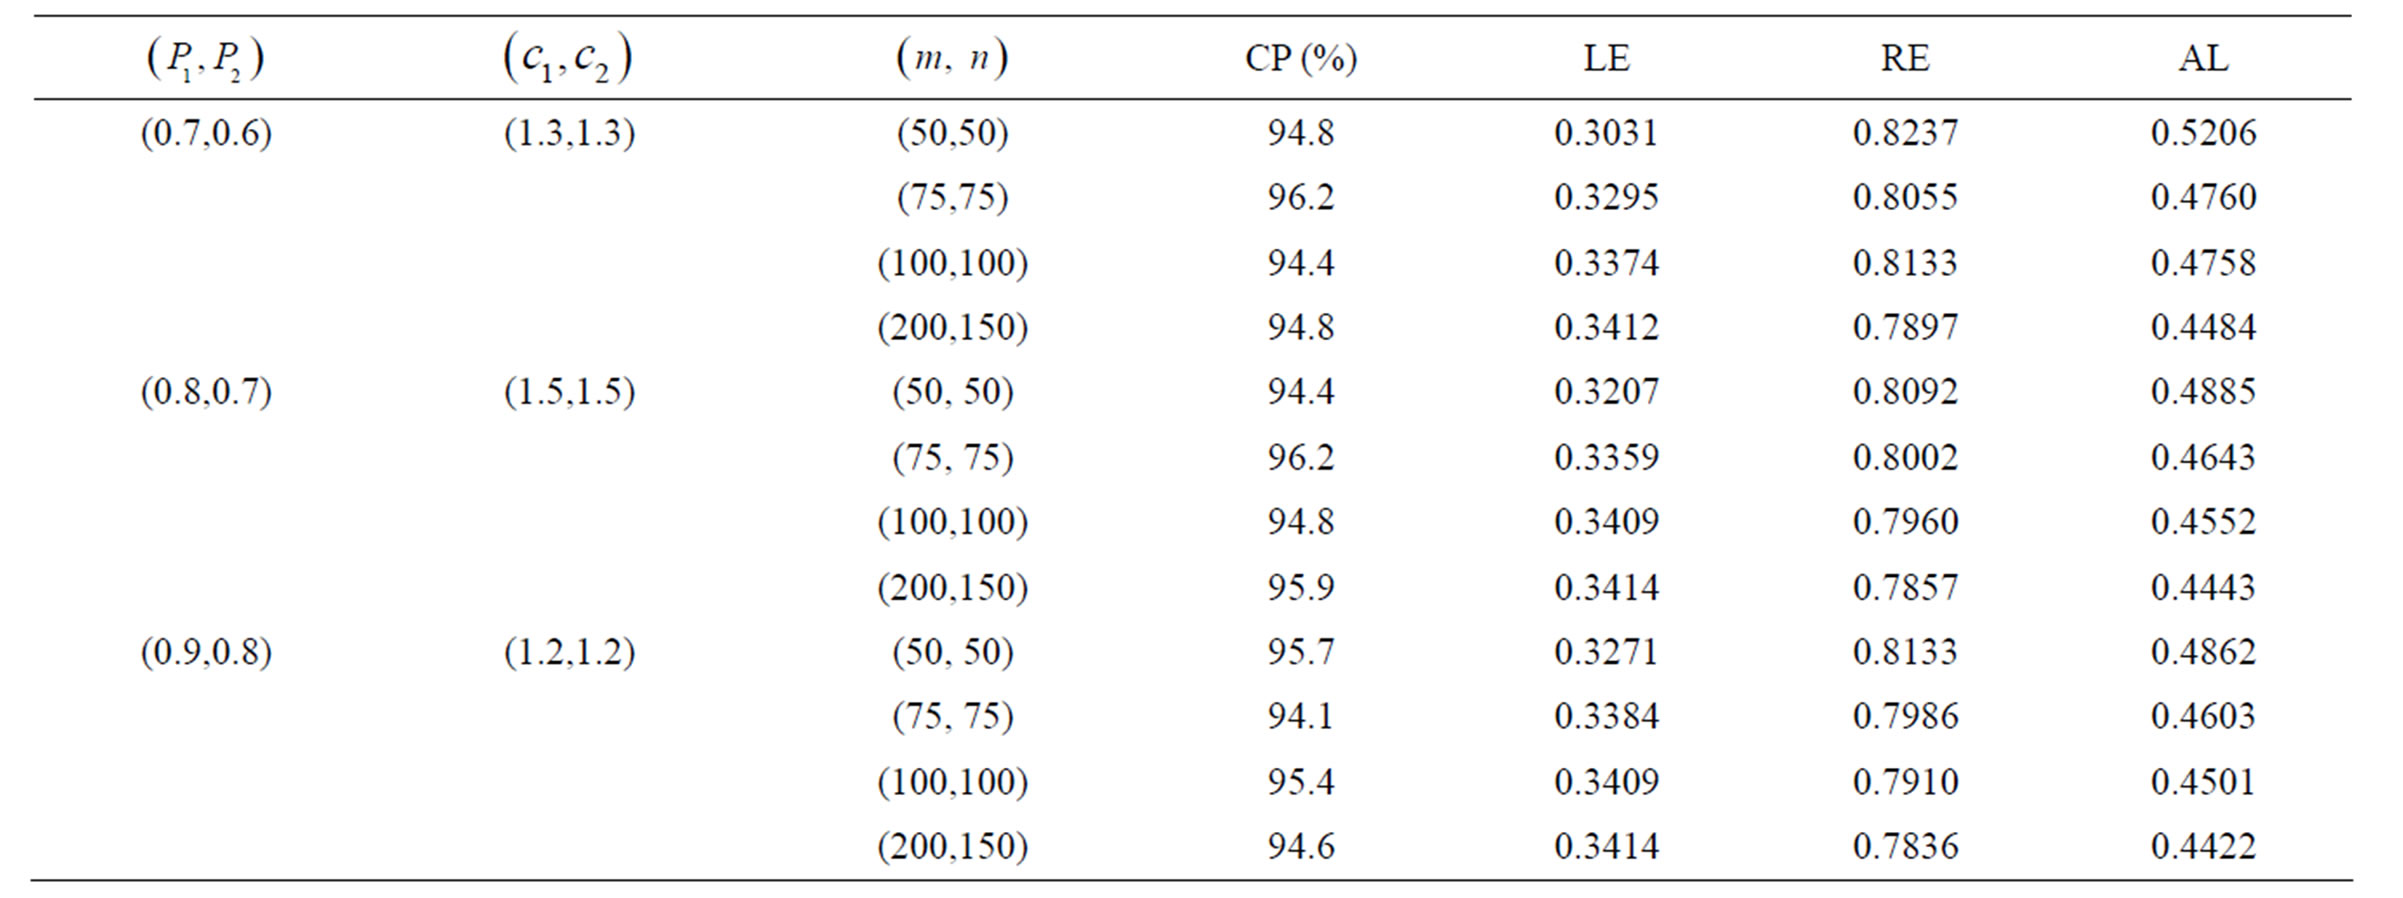
Table 2. Empirical likelihood confidence intervals for the ROC curve at 

Table 3. Empirical likelihood confidence intervals for the ROC curve at 

Table 4. Empirical likelihood confidence intervals for the ROC curve at 
4. Discussion
In this paper, we developed the smoothing empirical likelihood method for the ROC curve with missing datawhich is a natural extension of Claeskens et al. [7].The key technique used to impute the missing data is the random hot deck imputation procedure. Under imputation, the proposed smoothed EL statistic converges to a scaled chi-square distribution. In addition, we carry out the simulation studies to evaluate the finite sample performance of the proposed EL interval estimation for the ROC curve. For either smaller or larger q, the EL confidence intervals for the ROC curve have good coverage probabilities which are close to the nominal level. In summary, the proposed EL interval estimation is a reliable and useful tool for the ROC curve analysis with missing data. In the future, we will use other imputation methods to achieve better interval estimation and improve the performance.
5. Acknowledgements
The author acknowledges partial support under a FY09 Research Initiation Grant in Georgia State University. The author would like to thank Dr. Yichuan Zhao for his supervision.
Appendix. Proof of Theorem 1
To prove Theorem 1, we need some additional lemmassimilar to those in Qin and Qian [10]. We only give an outline of the proofs since they follow similar arguments as Qin and Qian [10].
Lemma A.1. Under the regularity conditions of Theorem 1, as , we have


where

 .
.
Proof of Lemma A.1. We follow the similar lines as Qin and Qian [10]. Let , and
, and . It follows that

Like Qin and Qian [10], we have that

We have

where  and
and  is the cumulative distribution function of
 . By Lemma A.1 of Qin and Qian [10], we have

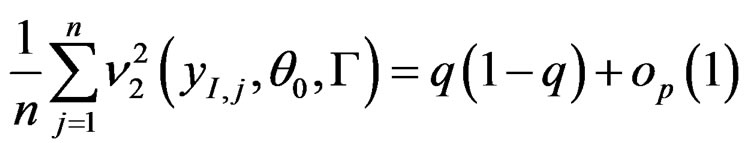
As Qin and Qian [10], we have that,


The rest of Lemma A.1 can be proved following same lines. It is omitted.
Lemma A.2. (Qin and Qian [10]). Assume that  Under the regularity conditions (i)-(v),


uniformly for  as
as , where c is a positive constant.
Proof of Lemma A.2. We follow the same arguments as Qin and Qian [10]. The proof is omitted.
Lemma A.3. (Qin and Qian [10]). Assume that  Under the regularity conditions (i)-(v), in probability there exists a root
  of Equation (1) such that,

as , and
, and  attains its local maximum value at
 .
.
Proof of Lemma A.3. We follow the similar lines as Qin and Qian [10]. The proof is omitted.
Lemma A.4. Assume that the regularity conditions are satisfied. Then, as 


where , and c0 are defined in Lemma A.1 and Theorem 1.
Proof of Lemma A.4. We follow the similar lines as Qin and Qian [10]. Let ,
,  ,
,
 ,
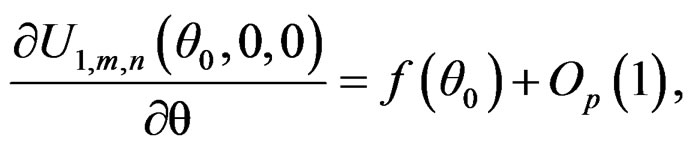
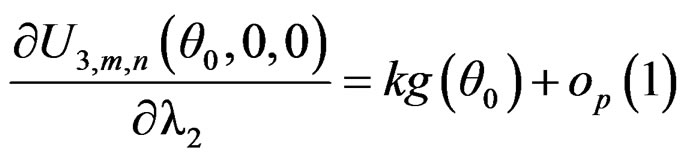
, . Using the Taylor expansion, Lemma A.2 and Lemma A.3, we have

where i = 1, 2, 3, . As Lemma 4.5 of Qin and Qian [10], we can show that


Thus

where

It follows that


From Lemma A.1, we have

thus Lemma A.4 is proved.
Proof of Theorem 1. It is similar to the proof of Theorem 1 in Qin and Qian [10]. The proof of Theorem 1 is omitted.