Multivariate and wavelet techniques of spontaneous electroencephalography and event related potentials during children maturation
—The role of phase resetting
()
1. INTRODUCTION
The relationship of slow wave maturation and P300 components during maturation, particularly in early childhood, has never been explored. The brain rhythms are produced by the spontaneous activity of neural networks throughout the lifespan. With increasing age, from childhood to adulthood, the lower frequency bands (delta and theta) decrease, and the higher frequency bands (alpha and beta) increase [1-3]. The increase in higher frequencies with age only occurs for relative power; in absolute power there is a decrease in high and low frequencies with age.
There are also other neural signals that change during human development, for example, the P300 component, probably the most studied endogenous event-related potential of the brain. The P300 is also related to the LPC, which would refer to posterior positive potentials during cognitive processing. These two related components belong to the family of the late positive waves, which occur at latencies of 250 to 500 ms [4]. In this report we would refer to P300 when explaining scientific literature, because is in P300 in which more of the work on maturation and time-frequency analysis has been done, and our results would be referred to the closely related but less restrictive term of LPC. Most studies have reported a decrease in P300 latency with increasing age from childhood to adulthood [5-9]. With regard to the amplitude, most results also indicate a decrease with age in visual P300. Courchesne et al. [5], using letters and random patterns as stimuli, found a decrease with age in the visual target P300. Thomas and Nelson [8], using faces as stimuli, and Van der Stelt et al. [9], using colour discrimination as the relevant task, found a decrease in P300 amplitude with age to target stimuli. Berman et al. [10] have also reported decreasing amplitude with age in a memory experimental paradigm. Flores et al. [11] also found a decrease with age in target LPC in a valid-invalid central cue Posner’s type experiment. Therefore, the general picture that can be drawn for the developmental trend of the visually induced P300 component is of a decrease in amplitude with age.
The fact that the P300 becomes increasingly affected by slower frequencies (delta and theta) has been pointed out [12]. Intriligator and Polich [13,14] also verified that spectral power and mean frequency were generally positively correlated with P300 amplitude and peak latency, primarily in the slower EEG bands. These authors found that the strongest relationships were observed for delta, theta and slower alpha activities, in the eyes open condition.
In a study focusing on the frequency decomposition of the P300, Klimesch, Schimke and Pienert [15] found that, although most of the P300 power lies in the delta range, latency and amplitude measures were significantly influenced by the theta band [12]. Digiacomo et al. [16] also found a positive correlation between the late positive component and the theta band, although in the latter study the delta band was not explored. In addition, positive associations between pre-stimulus theta and alpha band spectral power and P300 amplitude have been reported [4,17-20].
However, according to Verleger [21], the main portion of P300 power lies in the sub-delta and delta bands. He showed that most of the P300 power is due to EEG delta activity; the amplitude of the P300 response increases when single trials with high enhancement in the delta range (1 - 3.5 Hz) are averaged. These results are also supported by Digiacomo et al. [22] using wavelets. These authors observed that the topography of the phase resetting, measured as a high Inter-Trial Coherence (ITC) of the P300 time window in the delta range, lies in posterior sites, suggesting that the P300 component is partially constructed by the phase resetting of delta waves.
The possibility that the P300 component amplitude is, in fact, related to individual variability was explored [13, 14]. They found a positive relationship between delta, theta and low alpha power with P300 amplitude. Polich [19] also showed a parallel decrease in spontaneous delta and theta power in visual and auditory P300 with adults increasing in age, from young to late adulthood. Therefore, at least from correlational analysis, it is possible to observe a positive relation between P300 amplitude in adults (in baseline and in spontaneous EEG) and low frequency components, suggesting that both low frequency and P300 components would share physiological mechanisms. However, if the same relationship exists during child development is not established.
The present report is concerned with the relation between LPC and frequency bands during development. In this sense, this study must be considered a cross-analysis of the data presented in previous reports [1,11], and only the results which show a relationship between frequency bands in spontaneous EEG and LPC induced by visual stimulation will be reported. We think this approach can be useful for adding information about the interdependency of these two types of EEG parameters during development.
Both the EEG rhythms and the LPC component have been described as changing with age. The goal of the present report is to explore whether there is a co-maturation of the LPC component and brain rhythms and to suggest its possible relationship with phase resetting, ERSP and cortical pruning. A positive association between EEG and LPC parameters would be interpreted as a consequence of a common independent cause, i.e. synaptic pruning, or a functional relationship between LPC amplitude from a more basic phenomenon, such as low frequency brain rhythms phase resetting. The interdependence between these two types of phenomena would be explored by means of multivariate techniques. The broad variability between children and young adults in brain rhythms and LPC amplitude would allow the use of multivariate techniques to explore the co-variation pattern of these neurophysiological variables. The possibility that co-maturation would be due to phase resetting and ERSP in the delta range induced by the stimuli would be explored by means of time-frequency analysis.
The present results are not only the results of the authors but of many anonymous reviewers in different editorial settings which have contributed to the actual format. Although the empirical results has already been published [1,11] , we still think it is worthy to cross data to obtain new and unsuspected results.
The first part of the report would concentrate in establishing by multivariate techniques the co-maturation of LPC and brain rhythms. Then this range would be selected for trying to explain the LPC during development by a combination of a spatial filter provided by ITC on the pre-target oscillations, and by the increase of ERSP induced by the target stimulus.
2. EXPERIMENTAL PROCEDURES
2.1. Subjects
Data from eighteen children (12 female, 16 right-handed) aged 8 - 13 years (mean age: 10.06 ± 1.43) and twenty young adults (12 female, 20 right-handed) aged 18 - 23 years (mean age: 20.56 ± 1.3) were recorded and analyzed in this study. Experiments were conducted with the informed and written consent of each participant (parents/ tutors in the case of the children), following the Helsinki protocol.
2.2. Electrophysiological Recording
Three minutes of spontaneous EEG with open eyes and the EEG during the stimuli presentation phase were recorded from 20 scalp sites of the International 10 - 20 system (Fp1, Fp2, F3, F4, F7, F8, Fz, FCz, T7, T8, C3, C4, Cz, P7, P8, P3, P4, Pz, O1, O2), using tin electrodes mounted on an electrode cap (EASYCAP, HerrschingBreitbrunn, Germany) with two additional electrodes (M1, M2). Ocular movements (EOG) were recorded from two electrodes at the outer canthus of each eye for horizontal movements and one electrode under the left eye for vertical movements that was referred to FP1. The EEG was recorded with an average reference. All the scalp electrodes were referred to the mastoid average (M1 + M2/2). Impedance was maintained below 10 KΏ. Data were recorded in DC at 512 Hz, with a 20,000 amplification gain using a commercial AD acquisition and analysis board (ANT).
2.3. Stimuli Paradigm
After the recording of the spontaneous EEG, The Event Related Potentials (ERPs) during a visual central cue Posner paradigm were obtained [11]. The stimulus presentation was computer-controlled by the software EEVOKE (ANT, Enschede, The Netherlands). Participants were seated 0.50 m. away from a computer screen. A white fixation square was on during the whole experiment. The complete trial period included a central directional cue (S1) lasting 300 ms, an attentive waiting period of 1360 ms, and a subsequent peripheral target (S2) lasting 300 ms and subtending a visual angle of 4.56˚ situated 3.66˚ eccentrically in the horizontal meridian (Figure 1 from [11]). The targets were squared cartoon figures. A different figure was presented in each block of trials. The whole experiment consisted of 240 trials divided into 5 blocks, with an inter-trial interval of 1860ms, including 10 training trials. Since the central cue could indicate the correct or incorrect direction of the target’s appearance, two different conditions arose: validly cued targets (VC) (82.1% of trials) and invalidly cued targets (IC) (17.9% of trials). The subjects used the index finger of the right hand to respond to right-side targets by pressing a joystick button and, correspondingly, the index finger of the left hand to respond to left-side targets. During this task, the EEG was recorded using the same parameters as for the spontaneous EEG.
3. DATA ANALYSIS
3.1. Recording Processing and Analysis
A 0.1 Hz high-pass filter and a 20 Hz low-pass filter (zero phase shift type, low cut-off of 6 db/octava, high cut-off of 48 db/octava) were applied to the recordings. The artefacts in the resulting EEG recordings were corrected by an artefact correction protocol. The algorithm used for the artefact correction was based on PCA (BESA software). This method splits the EEG components associated with cerebral activity from artefacts (ocular movements, muscular or cardiac activity), on the basis of spatial distribution, after which the EEG can be reconstructed free of artefacts [23].
After the correction of artefacts, an artefact rejection protocol was applied. All the epochs for which the EEG exceeded ±100 μV in any channel were automatically discarded.
The Fast Fourier Transform (FFT) algorithm (BESA software) was applied to time domain data to convert them into the frequency domain. The FFT was applied to 2-second epochs. The FFT algorithm implemented in the BESA software was applied to time domain data to convert them into the frequency domain using a cosine square window, and no overlapping between epochs occurred. The PSD was computed in windows of 2 seconds (including 1024 sampling points), and then averaged for each individual subject. The PSD data were exported for each subject and electrode, and four frequency bands were defined: Delta (1 - 4 Hz), Theta (5 - 8 Hz), Alpha (9 - 12 Hz) and Beta (14 - 19 Hz). The statistical analysis of the comparison of the different frequency bands in children and young adults has been described elsewhere and will not be described here [1].
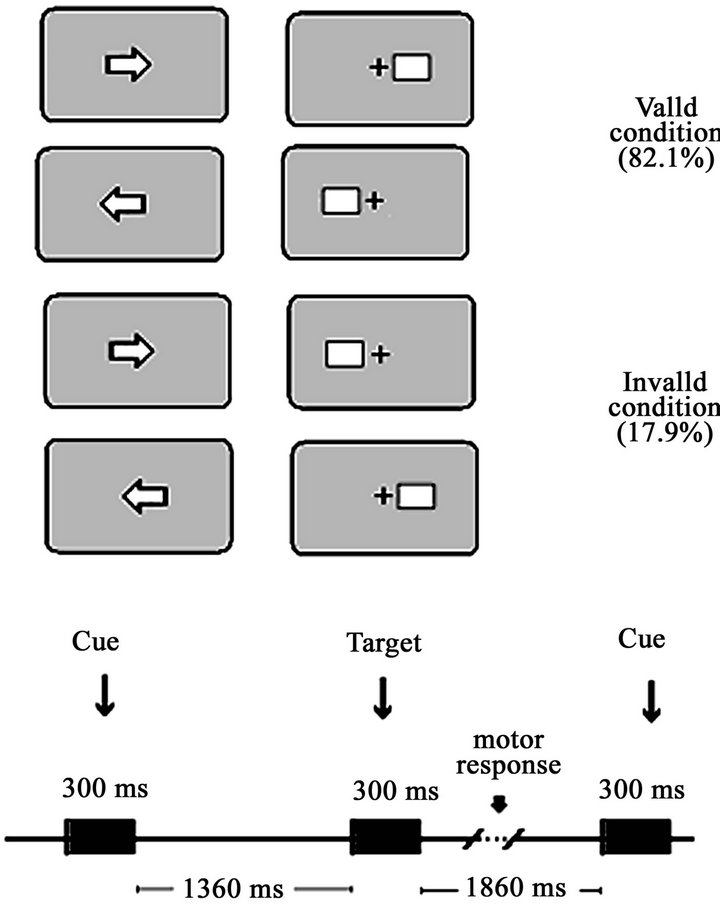
Figure 1. Central cue Posner paradigm performed in the study by Flores et al. (2010). The experimental paradigm comprised two conditions: valid and invalid. In the valid condition, the cue indicates the spatial position in which the target appears. In the invalid condition, the target appears on the opposite side to the cued location. The temporal contingencies of the different stimuli of the trial are displayed in the bottom part of the figure. The percentage of valid and invalid trials appears in parentheses.
The LPC component was obtained by averaging the EEG using the target stimuli as trigger. For the LPC amplitude, the mean voltage was analyzed in two conditions: valid and invalid trials. The average amplitude of the LPC was measured for both groups (children and young adults) in the 340 - 440 ms time-window for all the recorded electrodes. The LPC amplitudes were obtained in the valid and invalid trials in children and young adults. The continuous EEG was divided into epochs of 1200 ms; all epochs were aligned to a baseline from −200 to 0 ms preceding the target stimulus (S2) and 1000 ms poststimulus. ERPs were obtained for each subject by averaging the EEG, using the switching on of the target as a trigger. The average amplitude was measured for both groups in a posterior late positivity (possible P3b, and conceptualized in the broader concept of P300) in the 340 - 440 ms time-window (see [11] for more details).
3.2. Spearman’s Correlation Coefficients, Principal Component Analysis, Hierarchical Clustering and Topographical Analysis
Several techniques were performed to analyze whether the maturation of the spontaneous EEG is related to the LPC component maturation. The first method used was Spearman’s correlation. We correlated the spectral power of the three regions in the four frequency bands with the LPC in the valid and invalid conditions. In this report we are not interested in the cross-frequency correlation pattern, and, therefore, it will not be described here (see [1] for a full description of this aspect). We concentrated in the pattern of correlations between the different frequency bands and the LPC component. The two-tailed statistical significance of the Spearman’s correlation coefficients was obtained taken in account the number of subjects.
Afterwards, we used PCA, which identifies latent components that explain the variance in the experimental data [24]. The PCA was computed using SPSS 18.0. PCA was applied to the data matrix obtained from collapsing different electrodes. The electrodes Fp1, Fp2, F7, F3, Fz, F4 and F8 for the frontal region, FCz, T7, C3, Cz, C4 and T8 for the central region, and P7, P3, Pz, P4, P8, O1 and O2 for the posterior region were collapsed. We applied this procedure to the valid and invalid LPC and to the different brain rhythms. Finally, a matrix of 38 subjects by 18 variables (4 bands × 3 regions + 3 regions of LPC valid cues + 3 regions of LPC invalid cues) was analyzed. We computed this collapse in order to have more subjects than variables. Non-rotated PCA using the correlational matrix was used. The final data matrix had 38 subjects (rows) and 18 empirical variables (columns), including delta, theta, alpha, beta and LPC in valid and invalid locations. This method allows to express the total variance of the data in a few components which can easily be identified as a source of variance in the empirical data. In this particular data set it would allow to relate which components explain simultaneously the LPC and frequency bands variance. The explained variance of each extracted component was represented in order to evaluate how important was each extracted component in explaining the total data variance (Scree Test). In order to establish the physiological meaning of each component the loading factors of each empirical variable for components 1 - 10 was represented. As the loading factors are the correlation coefficient between a given empirical variable and the factorial scores of a given component, the two-tailed statistical significance of the loading factors was estimated taken in account the number of subjects (N = 38 for the total sample).
Additionally, a hierarchical clustering was applied to the standardized data. This method, by means of computing the Euclidean distance of empirical variables in the subject’s space (the converse can be used for classifying subjects in the variable space), makes it possible to classify the variables by their proximity in this space. The result is presented as a dendrogram providing different levels of aggregation. This analysis would give additional support to the pattern of co-variation revealed by the PCA and correlational analysis.
Finally, we represented the topographical maps of the bands and the LPC in both conditions in order to observe possible similarities between LPC and frequency bands. The topography should provide additional support for the co-maturation argument.
3.3. Time Frequency Analysis: Event Related Spectral Power Modulation and Inter-Trial Phase Coherence Analysis
To study time-frequency dynamics of the electrical activity elicited by the invalid and valid targets, single trials (from 1 second before target and 1 second after target) were convoluted time locked to the target stimuli using a complex Morlet wavelet:
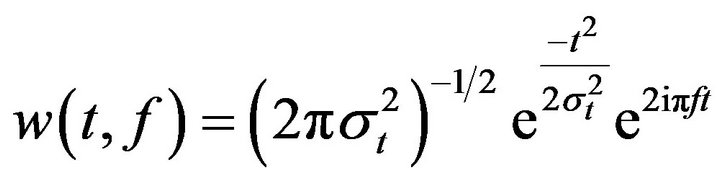 (1)
(1)
The relation 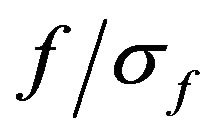 (where
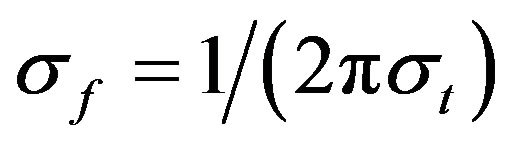 ) was set to 6.7 [25].
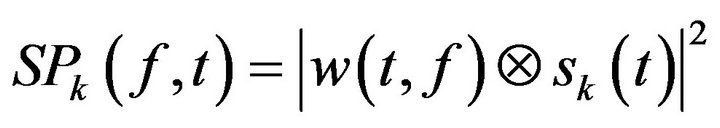
Changes in time varying energy (square of the convolution between wavelet and signal) in the studied frequencies (from 1 Hz to 40 Hz; linear increase) were computed for each trial
 (2)
(2)
(where  is the EEG signal at the kth trial, | | represents the complex norm and
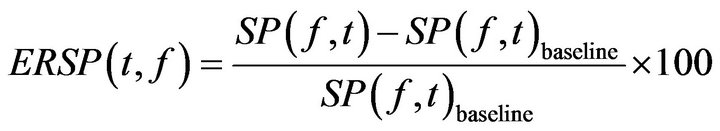
  is the complex convolution). ERSP modulations (increase or decrease of power respect to baseline) was analyzed in relation to averaged spectral power in the baseline period of 0.2 s before the target stimulus S2 after averaging the spectral power of all trials
  as:
as:
 (3)
(3)
In addition, the ITC was also computed to study the degree of coincidence of the phase of the different trials:
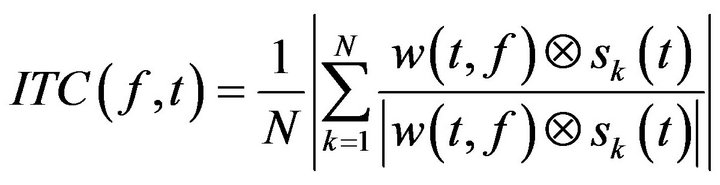 (4)
(4)
being N the total number of trials. Time frequency computation where performed under Matlab© 10 (Mathworks, Natick, MA).
For both ERSP and ITC the mean value in the time window of 200 - 400 ms, in the 2 - 3 Hz frequency range in which delta oscillations presented maximal ITC and post-target ERSP-PT was computed. The statistical analysis was computed between the ERSP-PT and ITC with respect to baseline in this time period and frequency range by means of t-test in three selected electrodes in which LPC presents a maximal amplitude: P3, P4 and Pz. Previously, the normality of the ERSP and ITC of children and young adults was demonstrated by means of the Kolmogorov-Smirnov goodness of fit test.
Spearman’s correlations of LPC amplitude vs. the delta range for the spontaneous power, non-normalized ERSP in baseline (ERSP-BL), ERSP-PT (200-400 ms post-target), ITC, ERSP-BL multiplied by ITC, and spontaneous delta * ITC were computed and expressed in a topographical map. These correlations expressed in topographical maps would provide an idea about the contribution of those parameters to the LPC formation. These parameters were also correlated with age for obtaining information about maturational trends.
3.4. Modeling of the Late Positive Component
As the hypothesis of present analysis was that the LPC is constructed by a combination of phase resetting of delta oscillations in baseline and an increase of ERSP induced by the target, the amplitude of the LPC component in each electrode was modeled by a multiple regression model (the frequency range used was 2 - 3 Hz).
 (5)
(5)
LPC_AMPi: Amplitude of the Late Positive Component in electrode i C1i and C2i: Linear slope coefficients obtained by the multiple regression in electrode i DeltaERSP_BLi: Event Related Spectral Perturbation during Baseline (–200 to 0 ms) in electrode i in delta range (2-4 Hz)
ITCi = Intertrial Coherence in electrode i ERSPi-PT = Post-target Event Related Spectral Perturbation (200 to 400 ms) in the delta range.
The statistical significance of the model and the predicted values of the model were expressed also topographically.
4. RESULTS
4.1. Co-Maturation of Late Positive Component and Brain Rhythms
We only analyzed the latencies of the late positivity (P3b) because the children did not present statistically significant anterior positivity (P3a) in a central cue Posner paradigm (Figure 1 from [11]).
Figure 2(a) shows the PSD of the spontaneous EEG activity. Children presented more power spectral density in all frequency bands (Figure 2(a)). These age-related differences were statistically significant and have been described elsewhere [1]. Regarding the LPC amplitude in the valid and invalid cue conditions, the children presented negative voltages in the frontal electrodes (Fz and FCz) and positive voltages in the posterior ones (Pz and Oz). In young adults there were no negative voltages in the frontal electrodes like those observed in children; however, the young adults showed high amplitude in the
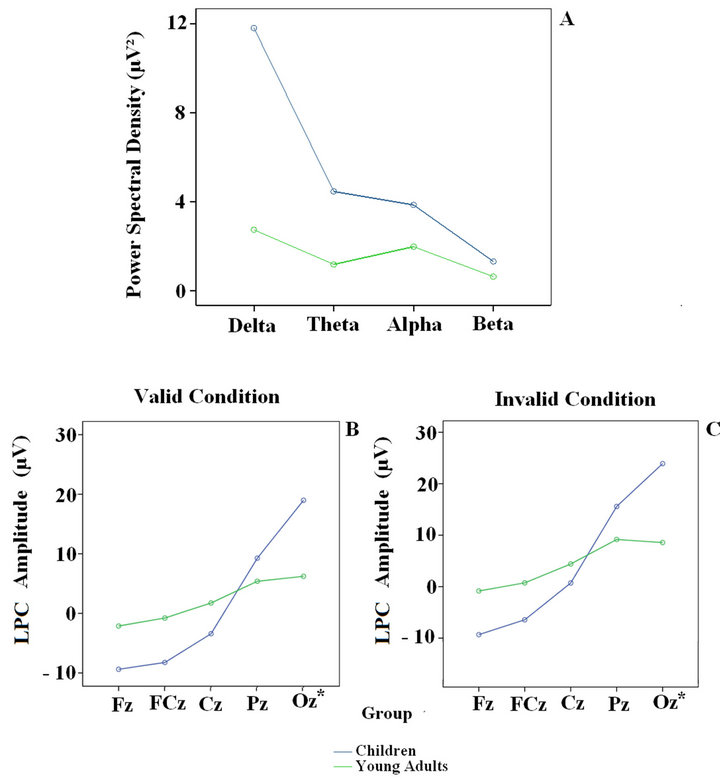
Figure 2. Power Spectral Density of the eyes open spontaneous EEG in the four frequency bands (above) and LPC amplitude for the central electrodes (Fz, FCz, Cz, Pz and Oz) in the valid and invalid conditions (below) in children and young adults. The Oz is a virtual electrode; it was calculated by averaging O1 and O2.
posterior region (Figures 2(b) and (c)). Age-related modulation of the spontaneous EEG and the LPC component had already been reported [1,11]. The general pattern consists in a decrease in power of all frequency bands and LPC amplitude in all frequency bands.
In the Spearman’s correlation matrix of the total sample (Figure 3), which analyzes the relationship between the three regions (frontal, central, posterior) of the four frequency bands and the three regions of valid and invalid LPC, high positive correlations between delta and theta band and the posterior region of LPC were found (marked in red), and high negative correlations in the anterior region (marked in blue) for the total sample. In addition, less systematic correlations were obtained between LPC and alpha and beta.
When the total sample was split and analyzed the two subjects sub-samples separately, the correlation matrix for the children and young adults showed a much lower pattern of correlation (Figure 4), given the loss of variability when the two groups are segregated. However, the correlation pattern of an inverse relationship between delta and LPC was maintained in children. This pattern was almost completely lost in young adults.
Figure 5 shows the topographical distribution of the EEG bands and the LPC in children and young adults. The topographical maps show that the most similar topography between LPC and brain rhythms is with the alpha rhythm. However, it must be pointed out that alpha did not show a co-variation with the LPC component (Figures 3 and 4). Delta presented two foci; one posterior and the other central. The LPC presents a similar