Properties of the Apathy Scale (AS) for use on Parkinson’s patients ()
1. INTRODUCTION
Parkinson’s disease (PD) is a chronic, progressive neurodegenerative disease that causes motor symptoms (rest tremor, bradykinesia, rigidity and loss of postural reflexes); neuropsychiatric symptoms (depression, anxiety, dementia, apathy, psychosis); autonomic symptoms (urinary incontinence, orthostatic hypotension and erectile dysfunction, among others); and a set of signs and symptoms that do not fit into the previous groups: dysphagia, drooling, seborrhea. Its epidemiology shows an overall prevalence of 1 out of every 1000 inhabitants, and a specific prevalence of 1 out of every 100 inhabitants in the 65+ age group [1].
Apathy has been conventionally defined as the absence or insufficiency of sensation, emotion, interest, or concern. Conceptually, it is closely related to emotionality and motivation [2], may present as a syndrome in itself or as part of other neuropsychiatric disorders, such as depression, despair, abulia, and dementia, in particular [3].
It is thought that apathy develops as a result of the disruption of auto-activation processes, resulting in an inability to think or act for oneself or on one’s own, while still maintaining a relatively unimpaired ability to respond or react to external prompting or stimuli [4,5].
Marin [3] was the first to present diagnostic criteria for apathy centered on lack of motivation unattributable to mental deterioration, emotional distress, or diminished level of consciousness, and manifesting as diminished goal-directed behavior, diminished goal-directed cognition, and diminished concomitants of goal-directed behavior.
Some diagnostic criteria have recently been published [6]. The Movement Disorder Society (MDS) Task Force to Assess the Clinimetric Properties of Apathy and Anhedonia Scales in PD patients [7] identified four apathy rating scales: the Apathy Evaluation Scale (AES); the abbreviated version of the AES, known as the Apathy Scale (AS); the Apathy Inventory (AI); and the Lille Apathy Rating Scale (LARS). The AS, AI, and LARS were specifically developed for patients with PD, but only the AS meets criteria to be “recommended”.
The main objective of the present study was to assess the psychometric properties of the AS [8] for evaluation of Ecuadorian patients with PD.
2. METHOD
2.1. Design
Cross sectional study, with re-test.
2.2. Patients
Consecutive patients with diagnosis of PD regularly followed-up at the Movement Disorders Unit, Neurology Department, Carlos Andrade Marín Hospital (Quito, Ecuador), according to the United Kingdom PD Society Brain Bank criteria [9]. Exclusion criteria were: cognitive impairment more than dubious or slight, evaluated by the Short Portable Mental Status Questionnaire of Pfeiffer (SPMSQ; cutoff 5/6) [10]; neurological impairment or disability due to any condition other than PD (e.g., hemiplegia or blindness) or psychiatric comorbidity (depression) that hindered appropriate evaluation according to the objective of the study.
The study was approved by the (Institutional Review Board) HCAM Teaching and Research Administrative Office. Informed consent was obtained from all patients.
2.3. Assessment
The AS [8] is based on the Apathy Evaluation Scale (AES) by Marin et al., [11] and consists of 14 of the 18 original items. In the AS, each question is read by the examiner and has four options of response: “not at all”, “slightly”, “some”, or “a lot”. Scores range from 0 to 42; higher scores indicate more severe apathy. Items 1 to 8 score: not at all = 3 points; slightly = 2; some = 1; a lot = 0; items 9 to14 score: not at all = 0; slightly = 1; some = 2; a lot = 3.
General demographic and clinical information was collected from each patient. In addition to the AS, the following assessment instruments were applied: Short Parkinson’s Evaluation Scale (SPES/SCOPA) for evaluation of motor dysfunction [12]; Hoehn & Yahr for staging (H&Y); Schwab & England Activities of Daily Living Scale (S&E) for disability; Hospital Anxiety and Depression Scale (HADS) for mood disorder [13]; Parkinson’s Impact Scale (PIMS) for health-related quality of life status (HRQoL) [14]; and Clinical Impression of Severity Index (CISI-PD) for global evaluation [15]. All the patients were evaluated in the ON state and the same day.
A cut-off point ≥14 from the total score of the AS was used to dichotomize the sample into apathetic and nonapathetic patients [8].
2.4. Statistical Analysis
The following attributes were explored:
Data was considered acceptable [16]. Observed scores should cover the range of the scale scores and mean should be near the theoretical median (an arbitrary limit 10% for the difference was proposed) [17]. Floor and ceiling effect must not exceed 15% and skewness should be between –1 to +1 [18].
Internal consistency. The inter-item correlation matrix (Spearman rho) (limits: ≥0.20 to ≤0.75) [19] and the item homogeneity index (threshold, 0.30) were obtained [20]. In addition, the corrected Item-total correlation was determined. As coefficient of internal consistency, the Guttman’s lambda (λ) was determined because assumptions for use of Cronbach’s alpha were not met [21]. Agreement (test-retest agreement). Seventy-one patients, randomly chosen, repeated the AS assessment 6 days after the first evaluation (range: from 4 to 9 days). Test-retest agreement was analysed by mean of the intraclass correlation coefficients (ICC) using an absolute agreement definition (2-way, random effects, intraclass correlation coefficient).
Precision. The standard error of measurement (SEM) for the AS was calculated ( ) [22].
Spearman rank correlation coefficient was used to determine the association between the AS and other measures in the study. A close association (rS ≥ 0.50) [23], was hypothesized between AS and HADS, a moderate (rS = 0.35 − 0.50) or low (rS ≤ 0.34) correlation was expected between AS and the other scales. To analyze known-groups validity the H&Y stages were used for stratification and the Kruskal-Wallis (KW) test for statistical analysis. We also used a HADS score cut-off ≥11, to consider the patients anxious or depressed [24] and AS score was compared between groups with and without the respective disorder applying the Mann-Withney test. For both analyses, a p value ≤ 0.05 was accepted as significant [25].
3. RESULTS
There were 73 women (34.5%) in the final sample of 211 patients, distributed according to H&Y stages as follows: 29 (13.7%) in Stage I; 47 (22.2%) in II; 98 (46.4%) in III; and 37 (17.7%) in IV, including two Stage V patients. Mean age was 67.5 ± 10.2 years, mean length of illness was 7.1 ± 5.5 years, and the mean l-dopa dose was 656.1 ± 292.7 mg/day. The mean AS score was 12.7 ± 7.1.
Classifying the patients according to the AS and the HADS, we found 33 patients with apathy alone (15.7%); 121 patients with neither apathy nor depression nor anxiety (57.3%); 42 patients with apathy and depression and/or anxiety (19.9%); finally, 15 patients with depression and/or anxiety without apathy (7.1%). There were no missing data. The difference between the mean and the median in the AS was 1.78 points. The floor and ceiling effects were 1.42 and 2.36, respectively; skew and kurtosis were 0.65 and −0.26, respectively (Table 1).
Internal consistency: Analysis of the correlation matrix showed the average interitem correlation was located between 0.21 and 0.37, with the exception of items 3 (−0.066) and 4 (−0.145). The item homogeneity index was 0.21. Reliability: The Guttman’s λ obtained was 0.89. When analyzing AS behavior—specifically the Guttman’s λ value—we observed that when the item was eliminated, items 3 and 4 would allow raising the reliability index to 0.9 (Table 2).
The SEM was 2.34 for the AS: values were 2.94 in H&Y Stage 1; 1.85 in Stage 2; 1.96 in Stage 3; and 2.65 in Stage 4.
Agreement (test-retest agreement). Seventy-one patients repeated the AS assessment 6 days after the first evaluation (range: from 4 to 9 days). The ICC using an absolute agreement definition was: ICC = 0.78 [(95% IC 0.73 − 0.82) f = 4.96; p ≤ 0.000].
When analyzing the correlations of the AS with the Spearman’s rho statistic, we obtained values of 0.49 with the HADS anxiety total, 0.48 with the depression section of that same scale, and 0.56 with the PIMS. The values were lower with the other tools.
Discriminative validity (Known-groups validity), analyzed with the Kruskal-Wallis statistic and using H&Y stages as segmentation variables—registered an X(2) value of 22.68 = p < 0.0001 (Table 3).
Using the HADS (a cut-off ≥ 11, to consider the patients anxious or depressed), the difference between groups was significant (p ≤ 0.001) (Table 4).
4. DISCUSSION
The data quality obtained from the AS is good, and only the difference between the mean and the median (1.78) is outside the (−1 - +1) range. There was no floor or ceiling effect, and the skew and kurtosis fell within accepted values. AS reliability was measured according to internal consistency and the reliability index and obtained optimal values (Guttman’s λ = 0.89). In the first validation study [8] it showed a Cronbach’s α value of 0.76. The scale would improve if we were to eliminate Items 3 and 4 (“Are you concerned about your condition?” “Do you put much effort into things?”) from this study sample. These items obtained the lowest correlation values. Moreover, the reliability coefficient improves if they are eliminated.
Convergent validity showed appropriate values when correlated with the PIMS (Spearman’s rho of 0.56) and with the HADS anxiety and depression subscales (Spearman’s rho of 0.498 and 0.485), which were higher than others reported [26], even though in general it is reportedly comparable to other instruments for evaluating depression and anxiety. These correlations are similar to others obtained. The highest value was obtained vis-à-vis the PIMS, which would indicate that apathy is a quality-of-life determinant [27].
Known-groups validity demonstrated that there were
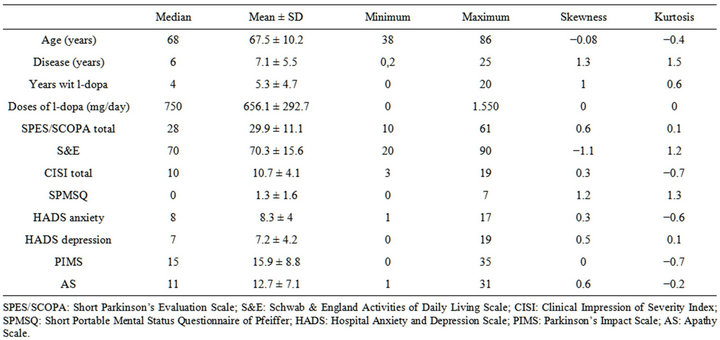
Table 1. Descriptives of the sample (N (f/m) 211 (73/138)).

Table 2. Metric properties of the AS.

Table 3. Discriminat validity for “known groups” (KruskalWallis test).
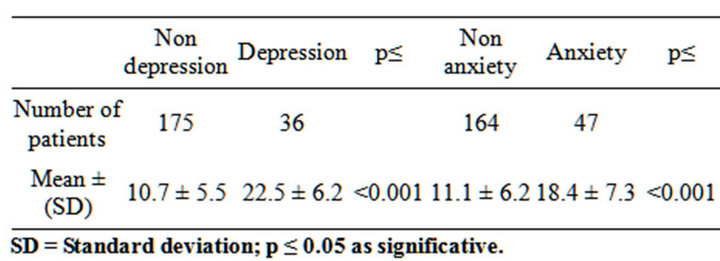
Table 4. Discriminat Validity for “known groups”. Apathy Scale, total score betwen groups (HADS cut/off). (Mann-Whit-ney Test).
differences between the degree of apathy and the H&Y stages (Table 3); this is in keeping with significant dif-ferences found between AS score and illness times and age. This finding is similar to another that has recently been reported [27], where Parkinson patients in the most advanced H&Y stages showed higher scores for apathy.
When we compared the patient group with apathy to the patient group without apathy or anxiety and/or depression, we found that apathetic patients were, in general, older and had both a longer period of illness and more greatly compromised motor ability, HADS anxiety and depression subscale scores and PIMS scores. These apathy results in Parkinson’s patients have not been reported in other publications [28,29].
Analyzing the apathy group in comparison with the apathy and anxiety and/or depression group, the latter had statistically significant higher scores on the AS and in the HADS anxiety and depression subscales (MannWithney test p = 0.001), Table 4. These findings are similar to those reported by P. Sockeel et al. [30].
5. CONCLUSIONS
In conclusion, apathy is a frequent entity in PD; 35.54% of patients show signs of it. In a Group of Parkinson’s patients, apathy coexists with depression and/or anxiety in 19.9%. Apathy negatively impacts the quality of life of these subjects. The AS proved to have suitable metric attributes in this specific PD patient sample: internal consistency, reliability, stability, and convergent and known-groups validity. Finally, it is important to be able to rely on consensual diagnostic criteria that can provide common elements for studying apathy in PD.