Use of Decision Theory to Predict Dust Storms over New Delhi, India ()
1. Introduction
The northwest parts of India are occupied by the great Indian Thar Desert. Back trajectory analysis, satellite data and chemical evidence marks this region as one of the major dust source regions [1] . It covers 20 million hectares of area in India. This region receives an annual rainfall of <300 mm. High surface temperature during summer (~50˚C) and low temperatures during winter (~−3˚C) are recorded. Wind speeds reach as high as 25 - 30 km/h in the summer raising tremendous amounts of dust in the atmosphere [2] .
New Delhi, the capital of India with a population more than 10 million, is affected by the dust/sand storms originating from the Thar Desert. Satellite back trajectory analysis shows that the Thar Desert contributes significantly to high dust loading over Delhi [3] . Most of the modeling studies carried out to predict dust storms were not truly operational. These were limited to either forecast of surface concentration or aerosol optical depth. They were carried out at synoptic scale resolutions. Present day modern information and decision systems provide timely, user friendly, issue targeted Earth-system information crucial in assisting decision-making processes for risk reduction.
Use of principles of decision making under risk requires certain probability information to be available. Probabilistic forecasting summarizes what is known or opinions about the future events. Despite its widespread use in atmospheric sciences, probabilistic forecasting remains a subtle and ambiguous way of representing the uncertainty related to future meteorological situation [4] . The motivation behind the application of decision theory to forecast an event is that the end user of a forecast must take a decision for action on the basis of each forecast [5] . A weather forecast has value only if it can be used to make decisions that yield benefits to the user [6] . The weather forecast is usually provided to the user with a better estimate of whether a defined climatic event of concern will occur in probabilistic or deterministic manner. A decision maker tries to follow an optimal action based on the given weather information.
Thomson [7] was the first to recognize the importance of decision theory in applications of space weather event predictions. Probabilistic or deterministic forecast is provided to users as decision making tools that can be used to meet their needs. The uncertainty reflected in using forecasts in terms of probability has proven to be more scientifically sound since it represents the actual state of nature and of more value to the users [8] .
Meteorological conditions are determinative factors for dust storm occurrence in dust and sand source areas [9] [10] . In order to predict whether a dust storm will occur or not under a certain meteorological condition, it is necessary to study how and to what degree each meteorological factor influences dust storm occurrence. A number of factors impact dust storm occurrence. Wind speed, sea level pressure and stability of the stratified structure are related to dust emission. Surface threshold for sand and dust entrainment is determined by evaporation, number of sunny hours and relative humidity [11] . Also cloud fraction, and maximum surface temperature can indirectly influence dust storm occurrence by creating or destroying its thermodynamic condition. However, all these factors cannot independently influence occurrence of a dust storm because of the unavoidable nonlinear interactions existing between each other [11] . Thus, it is important that we evaluate the impact and significance of a particular factor upon dust storm occurrence to gain understanding about the extent a certain variation in a particular factor can change the dust storm occurrence probability.
Objective forecasting or probabilistic forecasting serves as a guide to forecasters and is presently being studied extensively. A wide range of methodologies are being explored in research and in operational forecast. Our focus was 1) to evaluate the impact and significance of meteorological factors on a dust storm occurrence; and 2) to develop a decision matrix. We used the available historical data on dust storms and the weather data for forecasting. The forecast discussed is based on a statistical approach using long-term historical meteorological data just prior to the dust event. Ninety two major dust events that occurred over New Delhi, India during 2001-2012 were taken into consideration for the analysis.
2. Methodology
2.1. Study Site
New Delhi, India was selected for this study for developing a decision matrix. Dust storms for the period (2001 to 2012) were taken into consideration for developing this forecast. We chose this location for two major reasons, firstly, it is the most populated city in north India and secondly because we found this region of the IndoGangetic Plain to have high dust emission efficiency from our studies [Desouza et al. unpubl.]. New Delhi is located at an altitude of 230 m above mean sea level. It has a semi-arid climate with a mean temperature of 32˚C during the summer months accompanied with occasional heat waves where temperature rises to as high as 46˚C - 47˚C. The region is characterized by sandy loam soils.
2.2. Data Used
Several meteorological factors such as maximum temperature, wind speed, evaporation, number of sunny hours, relative humidity, sea level pressure, stability of stratified structure and cloud fraction to name a few influence dust raising activity. Sunny hours, evaporation, surface maximum and minimum temperature, and rainfall were obtained from a local observatory at the Indian Agricultural Research Institute, New Delhi. The other remaining factors were collected from the wunderground site (www.wunderground.com). Surface observations are collected from more than 29,000 weather stations located in countries around the globe including 6000 automated weather stations operating at various airports. Typically, these stations update data at 1, 3 or 6 hour intervals depending upon the station.
In order to fully characterize the meteorological conditions for dust storm occurrence, some of the meteorological factors such as maximum temperature, relative humidity, wind speed and evaporation were plotted together (Figure 1). Apart from these factors, several other factors influence the initiation of dust storms. For this a list of 10 possible predictors was considered. These predictors included mean temperature (MT), maximum temperature (HT), minimum temperature (LT), mean wind speed (MWS), maximum wind speed (HWS), wind direction (WD), number of sunny hours (SH), evaporation (E), minimum relative humidity (RH) and sea level pressure (SLP).
All these factors were tabulated and the impact and significance of each factor upon dust storm occurrence was determined. The extent to which a certain variation in a particular factor can change the dust storm occurrence probability was also determined.
Ninety two dust storms that occurred over Delhi during the study period (2001-2012) were analyzed to understand the circumstances under which the dust storms were initiated. With this knowledge a utility matrix was constructed. Based on the probability of occurrence of a dust storm under certain circumstances we picked up the option whose expected desirability was the greatest relative to the occurrence of dust storms.

Figure 1. Trend of meteorological parameters over Delhi, India (2001 to 2011).
We characterized the impact and significance of a given factor by the dust storm occurrence probabilities. The probability corresponding to the highest and lowest classes of that factor is given as follows:

where  > 0 indicates that the dust storm occurrence probability may be increased by increasing the factor
  at the station and
  < 0 indicates that
  affects dust storm occurrence negatively at that station.
If the prediction of a particular weather event is not 100% reliable then there is a risk in taking a decision. To minimize this risk, the best possible strategy is to be chosen by considering the consequences and situation or the state of the atmosphere. In risky situations, meteorological parameters or factors for which the impact is positive are selected and used in decision making. In short, a decision theory provides a framework within which forecasts can be evaluated and at the same time suggests the form in which forecast should be issued. In this regard the knowledge of the utility matrix helps to decide which observations to use and it also helps the meteorologists to decide upon a method of analysis.
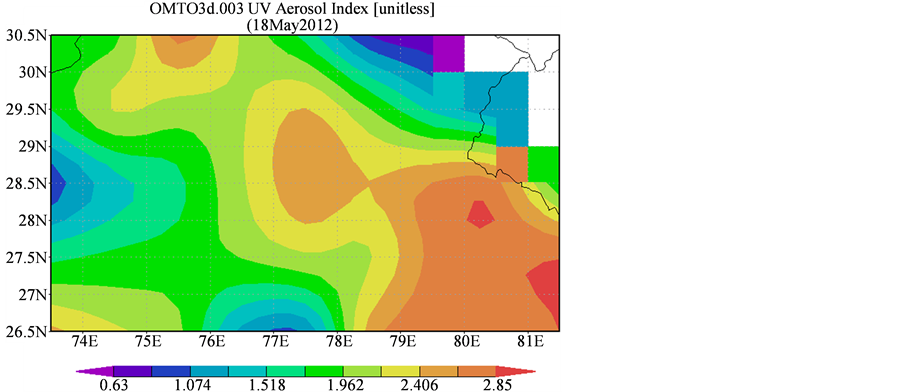
We validated the results using the Aerosol Index (AI) obtained from Ozone Monitoring Instrument (OMI) on board NASA’s Aura satellite. AI is a robust product for detecting transportation of desert dust. The Aura satellite indicates the presence of aerosol in the form of an index UV aerosol index [12] . The UV aerosol index (AI) is the measure of the departure of the spectral dependence of the upwelling UV radiance of the actual atmosphere relative to that of a pure molecular atmosphere as given by accurate radiative transfer calculations. Absorbing aerosols such as desert dust, volcanic ash and smoke decrease the spectral contrast yielding positive AI values whereas non absorbing aerosols increase spectral contrast which results in small negative AI values. The magnitude of the AI depends on aerosol properties, aerosol layer height above the surface, presence of clouds, and satellite viewing geometry. Brown pixels show higher aerosol concentrations, while yellow pixels show lower aerosol concentrations, and light blue regions indicate little or no aerosol. The long range transport of dust across the Indian subcontinent was studied using back trajectory analysis. The Hysplit was used to investigate the conditions that lead to dust storms [13] . For reasons of brevity, data for six major dust events that occurred during 2011 and 2012 are discussed.
3. Results and Discussion
3.1. Meteorological Factors
Drought is an underlying condition for dust storms occurrence. High temperature and evaporation are pre-disposing factors for dust storm occurrence. Of all the components of hydrological cycle, evaporation is the most difficult component because of complex interaction between the components of the land-plant-atmosphere system and also an essential factor influencing dust storm occurrence. Evaporation depends upon the supply of heat energy and vapor pressure gradient. The vapor pressure gradient in turn depends upon meteorological factors such as wind speed, atmospheric pressure solar radiation etc. [14] . Surface temperature, wind speed, relative humidity and evaporation plotted together in Figure 1 indicate that evaporation and wind speed follow a similar trend most often. This is because the stronger the wind the greater will be the turbulence, so there will be more evaporation. For surfaces that are not wet, there is a critical internal resistance to diffusion below which evaporation increases with an increase in wind speed [15] [16] . Above the critical internal resistance, evaporation decreases with an increasing wind speed. It was also shown by Lincare [17] that evaporation may increase or decrease as wind speed is increased depending upon the relative humidity. Thus, evaporation is influenced both by the wind speed and relative humidity. Wind speed will, therefore, support in creation of droughty conditions. It is also generally accepted [18] that one of the effects of wind breaks is to reduce the evaporation from the sheltered area, provided that the surface is wet.
The data in Figure 1 also indicates that relative humidity varies significantly when the temperature changes even when the actual amount of water vapor in the air remains the same. This indicates that as the temperature increases there is a fall in relative humidity and when the temperature goes down the relative humidity goes up. Relative humidity is a measure of the amount of water vapor contained in air at a particular temperature. Although the capacity of air to hold water increases with an increasing temperature, sufficient water is not always available to move it in to the air to fill that increased capacity. Hence, changes in temperature often lead to quite significant alterations in relative humidity. From this data, temperature and wind speed are identified as two important factors that influenced the initiation of dust storms by creating ideal conditions for erosion.
Apart from the factors already discussed, several other factors influence dust storm initiation. We, therefore, considered 10 possible predictors namely, mean temperature, maximum temperature and minimum temperature, mean wind speed, maximum wind speed, and wind direction, number of sunny hours, evaporation, minimum relative humidity and sea level pressure. Not all these factors had a positive impact on the occurrence of dust storms. Among the 10 predictors, number of sunny hours followed by maximum surface temperature had the highest positive impact (Table 1). The other factors that had a positive impact on the occurrence of dust storms in the order of magnitude were: Sea level pressure = minimum relative humidity > maximum wind speed > evaporation. In other words for all these factors  > 0.
> 0.
As evident from data in Table 1, sea level pressure had a positive impact on dust storm occurrence. This suggests that by lowering the sea level pressure a strong positive pressure transformation will take place due to incoming cold air which will consequently lead to strong surface winds which are beneficial for strong dust storm occurrence [19] . Drought is an underlying reason for a positive impact of the factors number of sunny hours, evaporation and maximum surface temperature with regard to dust storm occurrence.
Thus when  > 0 then the dust storm occurrence probability increases with the increase in that factor. If
  < 0, indicates that Xn affects dust storm occurrence negatively. This formulated statistics was utilized for decision making under uncertainty in decision theory. This decision theory resorts to the past experience to obtain an estimate of the probability of each possible state of nature.
3.2. Decision Matrix
From the 92 dust storms that occurred over New Delhi during 2001 to 2012, the circumstances under which these dust storms were initiated were statistically analyzed and a decision matrix was constructed based on the probability of occurrence of a dust storm.
With the information of actual state of the atmosphere, we simply picked up the option with the most desirable consequences for dust storm occurrence. As per the decision theory we chose the option whose exercise has the greatest expected benefit of forecasting a dust storm like surface temperature > 31˚C, relative humidity < 51%, wind speed > 5 m/s, sea level pressure < 1010 hPa, no precipitation etc. With these predictors we found that there is a good agreement between the relative occurrence of dust storms and the forecast (Table 2 and Table 3).
Of the six events that were validated five events (Figure 2 and Figure 3) indicated sufficiently high aerosol index. The TOMS aerosol index is related to aerosol optical depth, a measure of the amount of light prevented from passing through a column of atmosphere by the airborne particles. Dust particles in the atmosphere either absorb or scatter incoming sunlight. This results in a reduced visibility, and an increase in optical depth and aerosol index. The event that occurred on 5 May 2011 showed lower values of aerosol index. It was seen that for 5 May 2011, the wind speed was less than the threshold value but still the dust storm occurred. This dust storm was of a medium intensity with visibility more than two km. Because, the dust event was of a medium intensity, sufficient dust aerosols were probably not present in the atmosphere. Therefore, it did not reduce visibility to an extent that was noticed in the other dust storms where the visibility was <2 km. However, high temperature (~40˚C) on the previous day resulted in conditions conducive for the dust storm occurrence. It is important to note that based on the long-term weather data, the probability of temperature more than 40˚C is greater than 0.53. Further, wind speed in excess of 5 m/s is common during the pre-monsoon season with a probability of >0.92.
Pronounced effect on the optical properties was reported during intense dust storms over the north IndoGangetic Plains at Kanpur that resulted in higher aerosol index values [19] . Aerosol index images from Ozone Monitoring Instrument (OMI) are used to characterize aerosols in a region. This is used as a qualitative indicator of ultraviolet absorbing aerosols such as dust which give high positive values of aerosol index in the dust source region of the Thar Desert to the Indo-Gangetic basin.
Our results indicate that a probabilistic forecast works well, where only action needs to be taken. However, there is a limitation in this study, that the forecast is based on the meteorological conditions present just a few hours prior to the occurrence of a dust event. Thus, the forecast is of the very short range (0 - 6 hours). Future studies need to take into account the meteorological factors at least a day prior to the occurrence of the dust event in order to make a short-term forecast with a lead of one day. But retrieving meteorological data for forecast over their originating location (deserts, arid and semi arid regions etc.) using the conventional methods is difficult owing to the underlying surface and lack of observatories. Thus the met data dissemination facilities over the region need to be improved in order to improve prediction of dust storms.
Table 1. Impact of various meteorological parameters on dust storm occurrence.
Table 2. Decision matrix for select three dust events that occurred in 2011 over New Delhi, India.
Table 3. Decision matrix for select three dust events that occurred in 2012 over New Delhi, India.
 (a)
(a) (b)
(b) (c)
(c)
Figure 2. Aerosol index for dust events (a) 26 April 2011, (b) 3 May 2011 and (c) 5 May 2011 over New Delhi, India.
 (a)
(a) (b)
(b)
Figure 3. Aerosol index from OMI for two dust events on (a) 18 May and (b) 26 May 2012 over New Delhi, India.
4. Conclusion
In this paper, we evaluated the impact of several meteorological parameters on a dust storm occurrence. It was observed that maximum surface temperature (HT), maximum wind speed (HWS), evaporation (E), number of sunny hours and sea level pressure (SLP) had positive impact on dust storm occurrence. With this knowledge, a utility matrix was constructed. This was based on the probability of occurrence of a dust storm under certain meteorological conditions. We picked up the option whose expected desirability was the greatest relative to the occurrence of dust storms. As per the decision theory, we chose the option whose exercise had greatest expected benefit of forecasting a dust storm. It was seen that there was a good agreement between relative occurrence of dust storm and forecast.
Acknowledgements
We acknowledge Weather Wunderground for providing access to the data. We are grateful to the NASA/GSFC Ozone Processing Team (OPT) for kindly making available images of aerosol index data. We thank Dr. Blaise Desouza, Head, Crop Production, Central Institute for Cotton Research for the suggestions and improvements made on the manuscript.
NOTES
*Corresponding author.