Determination of coptis chinensis’ quality by FT-NIR spectroscopy ()
1. INTRODUCTION
Coptis chinensis has various pharmacological activities including antibacterial, antitumor and antiarrhythmic, and Copits chinensis has various medical efficacy including dissipating heat and drying the damp. Copits chinensis has been used widely in clinics, it has inhibition effect in Influenza Virus. Copits chinensis is used in treatment of gastrointestinal infection and upper respiratory infection. Oral copits chinensis extraction agent is used in treatment of hypertension, bone-joint tuberculosis and anal fissure [1]. Copits chinensis is not only the drug using of prescriptions but also used in Chinese traditional medicine. Chinese traditional medicine products that derived from copits chinensis are more than 100 types. Berberine is the main active component of coptis chinensis, it is a kind of isoquinoline alkaloids, molecular formula of berberine is [C20H18NO4]+ see Figure 1. Traditional methods for determining berberine in coptis chinensis are high performance liquid chromatography, atomic emission spectrometry and polarographic catalytic wave [2-4]. However, these traditional methods require tedious and complex processing for samples, and these methods are time-consuming and destructive. Standard method for determination of moisture content in coptis chinensis is physical method, but the physical method is destructive. All of these factors underlined the need for a reliable technique to quickly and nondestructively detect the quality of coptis chinensis.
In spectral analysis, the region that the wavelength is between 780 nm and 2500 nm is called NIR region. Most organic compounds and some inorganic matter’s fundamental frequency of chemical bond vibration are in this region. The chemical bonds of C-H, N-H, O-H and S-H had stretching vibration in NIR region, the analyte that has these chemical bonds could be determined by near infrared method.
NIR spectroscopy is a fast, accurate and non-destructive analytical tool, that can be considered as a replacement of the traditional chemical analysis [5-10]. The NIRS don’t need pretreatment and destroying the sample, is no-pollution, convenient and fast, could determine online, simultaneity detect multi-component, reproducibility is good, all of this advantage indicates that NIR

Figure 1. Molecular formula of berberine.
spectrum method is fit for detecting active component of the traditional chinese medicine, and NIR spectrum method has being used in analysis of Chinese medicine successfully [11-16]. In recent years, researches about determination berberine of coptis chinensis with NIRS has been reported [17,18], but moisture content has been ignored in these researches. Excessively high level of moisture will lead to mildew of traditional chinese medicine, while low level of moisture will effect on the pharmacodynamics of traditional chinese medicine, so moisture is an important quality index of traditional chinese medicine. This experiment takes berberine and moisture content as the quality assessment index of coptis chinensis according to traditional Chinese Medicine standard. ChongQing ShiZhu is the main producing area hometown of coptis chinensis, and is an important origin in China. Coptis chinensis used in this experiment is main planted in ChongQing ShiZhu.
2. MATERIALS AND METHODS
2.1. Sample Preparation
108 samples were taken from the habitats of herbs. The Coptis chinensis samples included Coptis chinensis Franch (ShiZhu), Coptis deltoidea C. Y. Cheng et Hsiao (ShiZhu), Coptis chinensis Franch (HuBei), and the Coptis chinensis samples classed into three level. One sample was selected randomly and crushed fineness 16 mesh sieve, 40 mesh sieve, 70 mesh sieve, 100 mesh sieve, 120 mesh sieve with plant grinder (FZ102, Taisite, TianJin, China). Their NIR spectra were collected. Suitable particle size was confirmed with principal component analysis. All samples were crushed whit suitable particle size. The calibration set contained 78 samples and the prediction set contained 30 samples.
2.2. Laboratory Reference Method
Berberine: 2.0 g removal from each samples crushed were immersed with 100.0 g deionized water for 1 hour. The samples were ultrasonic extracted with ultrasonic cleaner (SB-5200D, Xinzhi, ZheJiang, China) for 1 hour, centrifugated at 12000 rpm for 40 min with temperaturecontrolled centrifuge (Z323K, Hermle, Germany) and filtered. Ultraviolet spectrum of the samples and berberine standard samples (100453-200501, national institute for the control of pharmaceutical and biological products, China) were collected at the wavenumber of 336 nm with UV-spectrometer (U-3010, Hitachi, Japan) [1].
Moisture: 2.0 g removal from each samples crushed again were weighed and noted. Then the samples were dried in 100˚C for 3 hours with thermostatic drying chamber (101, Hunan, ZheJiang, China), samples were cooled, and then the samples were weighed and noted [1].
2.3 NIR Spectra Collection
The NIR spectra were collected in transmission mode using FT-NIR spectrometer (Vector 22/N, Bruker, Germany) over the wave number range of 4,000 - 10,000 cm−1. The spectra were collected at 4 cm−1 data intervals and each sample spectrum was obtained by averaging 64 scans.
2.4. Software Analysis
The calibration model for Determination of Coptis chinensis’ quality was built with Bruker OPUS software, version 5.5. Spectrum pretreatment method and PCs were chose by the software. The overall redictability of each calibration model was expressed in terms of root mean square errors of cross validation (RMSECV) and root mean square errors of prediction (RMSEP) [19-22].
3. RESULTS AND DISCUSSION
3.1. Choice of Particle Size
One sample was selected randomly and crushed with 16 mesh sieve, 40 mesh sieve, 70 mesh sieve, 100 mesh sieve, 120 mesh sieve. Their NIR spectra were collected. NIR Spectrums were Figure 2.
Absorbancedecreased gradually with the decrease of the particle size, Scattering coefficient increased gradually with the decrease of particle size. Spectral intensity decreased as the increasing of scattering coefficient according to Eq.1.
A = a + b(K/S) (1)
The coptis chinensis through 100 mesh sieve were fit for the experiment according to principal component analysis. So all samples crushed with 100 mesh sieve in this experiment.
3.2. NIR Spectra of Calibration Set Samples
All NIR spectra of calibration set samples in this experiment were Figure 3. Effective information band for quantitative detection focused on the band (λ = 7000 ~ 4000) according to Figure 3. The information contained

Figure 2. NIR spectra of coptis chinensis with different particle size. The particle size from top to bottom in turn reduce: 16, 40, 70, 100, 120 mesh sieve, but Two spectral lines (100 and 120 mesh sieve) almost superposition.

Figure 3. NIR spectra of calibration set samples. Scanning 78 samples crushed with 100 mesh sieve including in the calibration set.
stretching vibration of C-H band in -CH3, C-H band in -CH2, C-H band in CHa=CHb and O-H band in H2O.
3.3. Choice of Spectrum Pretreatment Method
Spectral signal that is determined by detector contains not only spectral information but also several of noises. Origin of error contained scattering of light, stray light, instrument response and noise. These factors led to baseline drift and non-repeated of spectrum. Origin spectrum that processed by derivative protected against the influence of baseline drift. It is effective to discriminate overlapping peaks, increase the resolution and sensitivity. But derivative spectrophotometry amplify difference of adjacent wavelength point, it leads to amplification of noise and decrease of signal-to-noise ratio. The pretreatment method should be select to different spectrum of samples. Several kinds of pretreatment method were compared in this experiment. Parameters of model are in the Table 1. From Table 1, the effect of model that pretreated with first derivative and vector normalization is best in this experiment. Figure 4 was the spectrum pretreated with first derivative and vector normalization.
3.4. Determination of PCs in Model Development
The number of PCs in the PLS model was very important because few components would generate an underfitted model, fitted loosely the data structure. Using too many, on the other hand, generated an overfitted model, one which fitted parts of the noise of the calibration set. The changes of RMSECV with PCs are Figures 5 and 6.
The appropriate PCs number of berberine and H2O are 6 and 8 separately according to Figures 5 and 6.
3.5. External Verification of Model
30 coptis chinensis samples of prediction set were pre-

Table 1. Comparison of model effect with different pretreatment method.

Figure 4. Spectral pretreated with first derivative and vector normalization. The spectra go through some pretreated processing, and the best effect were first derivative + vector normalization process.
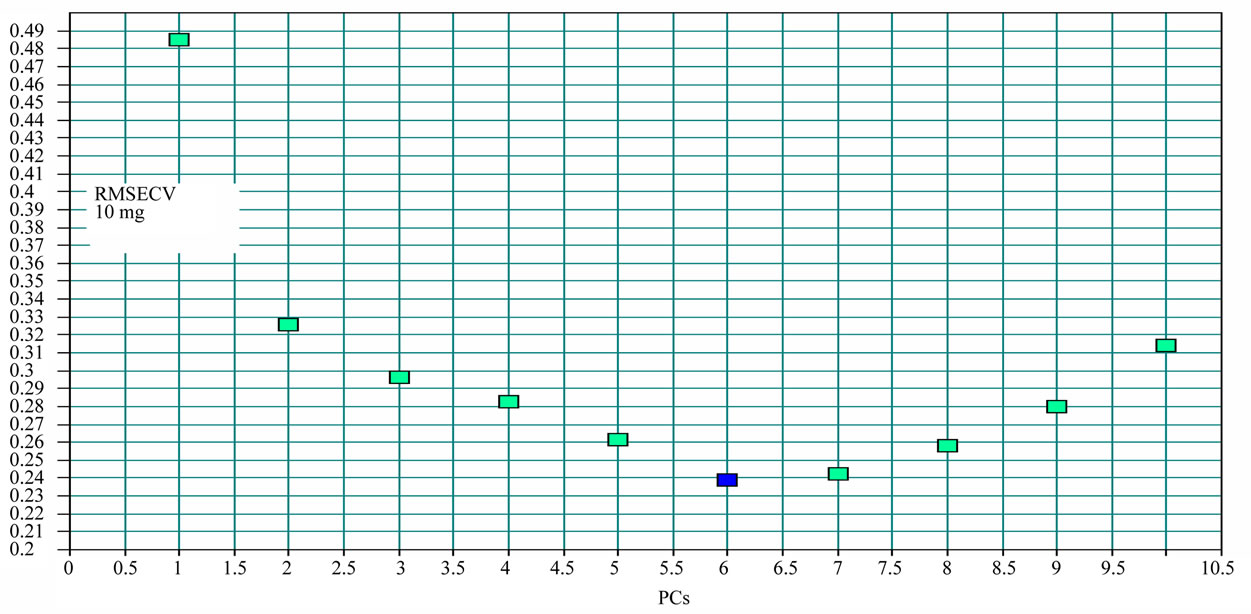
Figure 5. The changes of residual variance with PCs: Coptis chinensis.
dicted about berberine and H2O with the model that built in this experiment. SEP of berberine and H2O were separately 0.104% and 0.330%. R2 of berberine and H2O were separately 93.47% and 91.46%. The experimental results were credible. The scatter plot of berberine and H2O between NIR predicted and measured values were Figure 7 and Figure 8.