Depositional Environment of Sediments in Tonle Sap Sedimentary Basin, Western Part of Cambodia: Insights from Field and Geochemical Studies ()
1. Introduction
Cambodia consists of seven sedimentary basins with onshore and offshore oil and gas potential, such as in Khmer, Kampong-Som, Tonle Sap, Khorat, Preah, Chung, and Svayrieng sedimentary basins [1] [2] . In the early 1960s, Polish geologists conducted geological fields and notified some oil and gas seepages in the southwest Tonle Sap sedimentary basin. In 1996, hydrocarbon exploration was surveyed with airborne gravity and magnetic survey around this basin by Japan National Oil Corporation (JNOC). Based on these geophysical data, this sedimentary basin covers approximately 23,800 km2 in the center of Cambodia [1] [2] and was defined into two sub-sedimentary basins [3] . However, there is no detailed study of the depositional environment of the Permian unit in this basin yet. Hence, this paper investigates two outcrops of Permian sediments exposed in the western part of the Tonle Sap sedimentary basin. They were selected to represent the Permian unit in this basin (Figure 1).
![]()
Figure 1. Geological map of study areas. Red dots are the sampling locations, Takream and Somlout [4] .
The characterization of the depositional environment of sediments in the Tonle Sap sedimentary basin was obtained from field investigation, lithological, sedimentological, paleontological, and geochemical analysis. Two primary purposes of this research are 1) to investigate detailed lithostratigraphy of these Permian sedimentary rocks and 2) to discuss the depositional environment using sedimentology paleontology, and geochemistry studies.
2. Geological Setting and Basin Evolution
The regional geology of Cambodia was probably affected by the combination of three primary collisions, such as Sibumasu-Sukhothai Arc and Indochina, South China and Indochina and Paleo-Pacific and Indochina [5] [6] , which resulted in three regional Fold Belts in Indochina as well as inside Cambodia, and was identified as Phetchabun fold belt in the northwestern part, Khmer Chanthaburi fold belt, and Kampot fold belt in the southwestern region (Figure 2), that be affected
![]()
Figure 2. Indochina map with selected structural elements, two major fold belts transect the region and connect to the Mae Ping Fault Zone (MPFZ) and Three Pagoda Fault Zone (TPFZ) [6] .
by the many phases of folding orogeny during the collision of Sukhothai Arc and western Indochina Terrane in Late Triassic-Early Jurassic [6] [7] [8] [9] .
Tonle Sap sedimentary basin is bordered to the north by the orogenic uplift that is comparable to the transpression zone of the northwest-southeast-trending Mae Ping Fault zone, and farther to the north by the southernmost monocline of Khorat Basin, Thailand (Figure 2) [1] [7] . This foreland sedimentary basin may have developed between the Paleozoic and Mesozoic due to being filled with Late Carboniferous-Permian carbonate and Mesozoic sandstone with alternative sandstones-claystone, limestone, and claystone with some coal beds [1] [3] . Furthermore, this sedimentary basin was affected by Mae Ping Fault in the Middle Eocene [7] [9] . This fault is the main strike-slip fault which extended from Thailand in the northwest, cutting the Tonle Sap basin and continued to southeastward to the Vietnam Sea. The left-lateral strike-slip Mae Ping Fault [6] , which formed in Middle Eocene-Early Oligocene might create rifting and extension in Tonle Sap sedimentary basin and end in Early Oligocene [7] ; and can change direction to be right-lateral in Early Miocene [10] , that might produce the basin inversion during the Early-Middle Miocene.
3. Materials and Methods
3.1. Stratigraphy Measurement
The geological fieldwork has been conducted in Takream commune, Banan District, and Somlout commune, Somlout District in Battambang Province, the western part of the Tonle Sap sedimentary basin. The thickness of individual facies succession was measured from these two well-exposed Permian sedimentary outcrops, Takream and Somlout. Each stratigraphy interval’s sedimentary texture, structure, fossil content, and thickness have been recorded for facies analysis as evidence to interpret the sedimentary process and the details of the depositional environment.
3.2. Laboratory Works
There are 13 representative samples, five samples from Somlout and eight samples from Takream, calcareous shale (solid green triangle in the stratigraphy column), and limestone (solid red triangle in the stratigraphy column) (Figure 3, Figure 4), were collected during the construction stratigraphy column. These samples were prepared through laboratory works, petrography, X-ray fluorescence (XRF), and inductively coupled plasma mass spectrometry (ICP-MS).
The samples were cleaned, cut, and ground with diamond powder to get a thickness of 30 micrometers for petrography analysis to identify the minerals and fossil contents with Eclipse Ci-Pol. Moreover, samples were grounded to be powder and compacted in sample holders for XRF analysis with the model of Rigaku ZSX Primus III+. Thus, the oxide compound of these samples can be identified. The other parts of the samples were ground to 74 micrometers in a
![]()
Figure 3. Stratigraphy column of Somlout, green triangle is shale sample, red triangle is limestone sample.
ball mill of about 0.25 mg per sample and analyzed with ICP-MS at ALS analytical services in Vientiane, Laos. For this analysis, powder samples were digested with perchloric, nitric, hydrofluoric, and hydrochloric acids. The residue was topped up with dilute hydrochloric acid. The trace and major elements were plotted in indicating depositional conditions.
4. Result and Discussion
4.1. Sedimentological Features
According to stratigraphy measurement, the stratigraphy column of Takream and Somlout outcrops consist of the same lithofacies of sediments, calcareous shale, and limestone, however, the results of petrography, XRF, and ICP -MS analysis showed that the properties of these facies are different in compositions (Table 1, Table 2). The details of lithofacies analysis and interpretation are described in the following sections.
4.1.1. Somlout Outcrop
Somlout outcrop is controlled by an anticline structure with a total thickness of approximately 17.5 m (Figure 3), including two lithofacies of calcareous shale and limestone. Those lithofacies have a strike N080˚E 70˚NW from the horizontal plane. The calcareous shale facies were exposed to approximately 0.4 - 2.0 m bedding. It is black, silt to clay size, and some parts were affected by moderate to predominantly weathered. The limestone facies are subdivided into medium and coarse-grained limestone. The dark grey medium-grained limestone facies exposed approximately 0.1 - 0.3 m in thickness with moderately sorted. It is composed of mainly carbonated grain and micrite. The coarse-grained limestone facies are medium grey color and poorly sorted. It was deposited at the bottom of the formation with thicknesses of about 9 m. It is dominated by carbonate grain, micrite, and lithic fragments with the raging size of 0.5 - 1 cm.
4.1.2. Takream Outcrop
Takream outcrop is well bedded with a total thickness of approximately 105.0 m (Figure 4), including two distinguish lithofacies of calcareous shale and limestone with N055˚E 20˚NW of dipping angle. Shale facies were deposited approximately 4.0 - 15.0 m, and the bedding also contained sub-bedding in them with a thickness between 0.2 - 0.4 m. Moreover, these facies were exposed as an interbedded layer with limestone bedding. Its grain size varies from silt to clay grain, black color, a massive structure, and is rich in carbonate minerals. Limestone facies were exposed as inter-bedded, with thicknesses between 2.5 - 40.0 m, and they also contain sub-bedding in them with a varied range of thickness of 0.2 - 0.6 m. These facies are characterized as dark grey color, very fine grain, and massive structure. Moreover, according to physical properties, it is dominated by calcite and matrix and considered matrix-supported limestone.
4.2. Lithofacies Analysis
According to the examined of petrographically analysis, Somlout shale consists mainly of clay minerals, less quartz, and fracture creaking of organic matter (black color), which indicates as the high temperature was applied after deposition (Figure 5(a), Figure 5(b)) [11] . This shale is dominated by clay −96.20%, and quartz −3.8%, and is classified as a clay-dominated lithotype [12] . Furthermore, limestone consists mainly of calcite grain, quartz, micrite, and fossil. They
![]()
Figure 4. Stratigraphy column of Takream, green triangle is shale sample, red triangle is limestone sample.
![]()
Figure 5. Petrographic analysis of Somlout Samples. (a) and (b) are S-S1, showing the fracture creaking of organic matter in black color; (c) and (d) are S-L1, showing bivalve shell that was replaced by quartz; (e) and (f) are S-L3, showing bryozoan; (g) and (h) are S-L4, showing fusulinid foraminifera. Q: Quartz, Cl: Clay minerals, FC: Fracture creaking of organic matter, Bsh: Bivalve shell, Br: Bryozoan, Ca: Calcite, and Mc: Micrite.
are dominant grains, ranging from −46.79% −64.22% and micrite −35.78% −53.28%. Limestones are classified as wackestone and packstone [13] . The presence of substantial micrite in limestone is commonly interpreted to indicate the deposition under the low energy flow [14] . Therefore, fragmental fossils such as 2 mm of bivalve shells in S-L1 (Figure 5(c), Figure 5(d)), 1 - 2 mm bryozoan (Figure 5(e), Figure 5(f)), and 1 mm fusulinid foraminifera in S-L3 (Figure 5(g), Figure 5(h)) were found to be the depositional indicators.
Takream calcareous shale consists of carbonate mud, calcite minerals, and organic matter. It comprises carbonate mud −50.80% - 60.60%, quartz −30.20% to 43.00%, and clay minerals −6.20% to 9.20%. It is classified as silica-rich carbonate mudstone [12] . Under the microscope, sample T-S1 showed carbonate mud, calcite mineral, siliceous sponge spicules, and organic matter (Figure 6(a), Figure 6(b)). Limestone mainly comprises carbonate mud −22.60% to 96.80% and calcite grain −3.20% to 77.40% (Figure 6(c), Figure 6(d)). It is classified as packstone and lime-mudstone [13] .
4.3. Major Elements
Major oxide concentrations in calcareous shales and limestones of Somlout and Takream were obtained from XRF analysis (Table 1). Calcareous shale has a high concentration of SiO2 ranging from 42.00% to 75.00% with a mean value of 62.68%, CaO ranges from 0.96% to 26.30% with a mean value of 12.01%, Al2O3 ranges from 0.97% to 10.05% with a mean value of 5.92%, and Fe2O3 ranges from 1.40% to 5.29% with a mean value of 3.56%. Meanwhile, limestone concentrations of SiO2 range from 0.38% - 15.85% with the mean value of 9.97%, CaO ranges from 42.60% - 57.00% with the mean value of 47.99%, Al2O3 ranges from 0.04% - 2.49% with the mean value of 0.75%, and Fe2O3 ranges from 0.05% - 1.68% with the mean value of 0.56%. These represent the most abundant elements (Si, Ca, Al, and Fe), consistent with the abundant occurrence of carbonate minerals, quartz, and pyrite in calcareous shale and limestones of the Tonle Sap
![]()
Figure 6. Petrographic analysis of Takream samples. (a) and (b) are T-S1 under PPL and XPL; (c) and (d) are T-LB under PPL and XPL. Ca: Calcite grain, OM: Organic matter, Cm: carbonate mud, Hs: Hexactine sponge, Ms: Monaxon sponge.
![]()
Table 1. Major elements concentration (wt%) of Somlout and Takream samples.
sedimentary basin.
4.4. Trace Elements
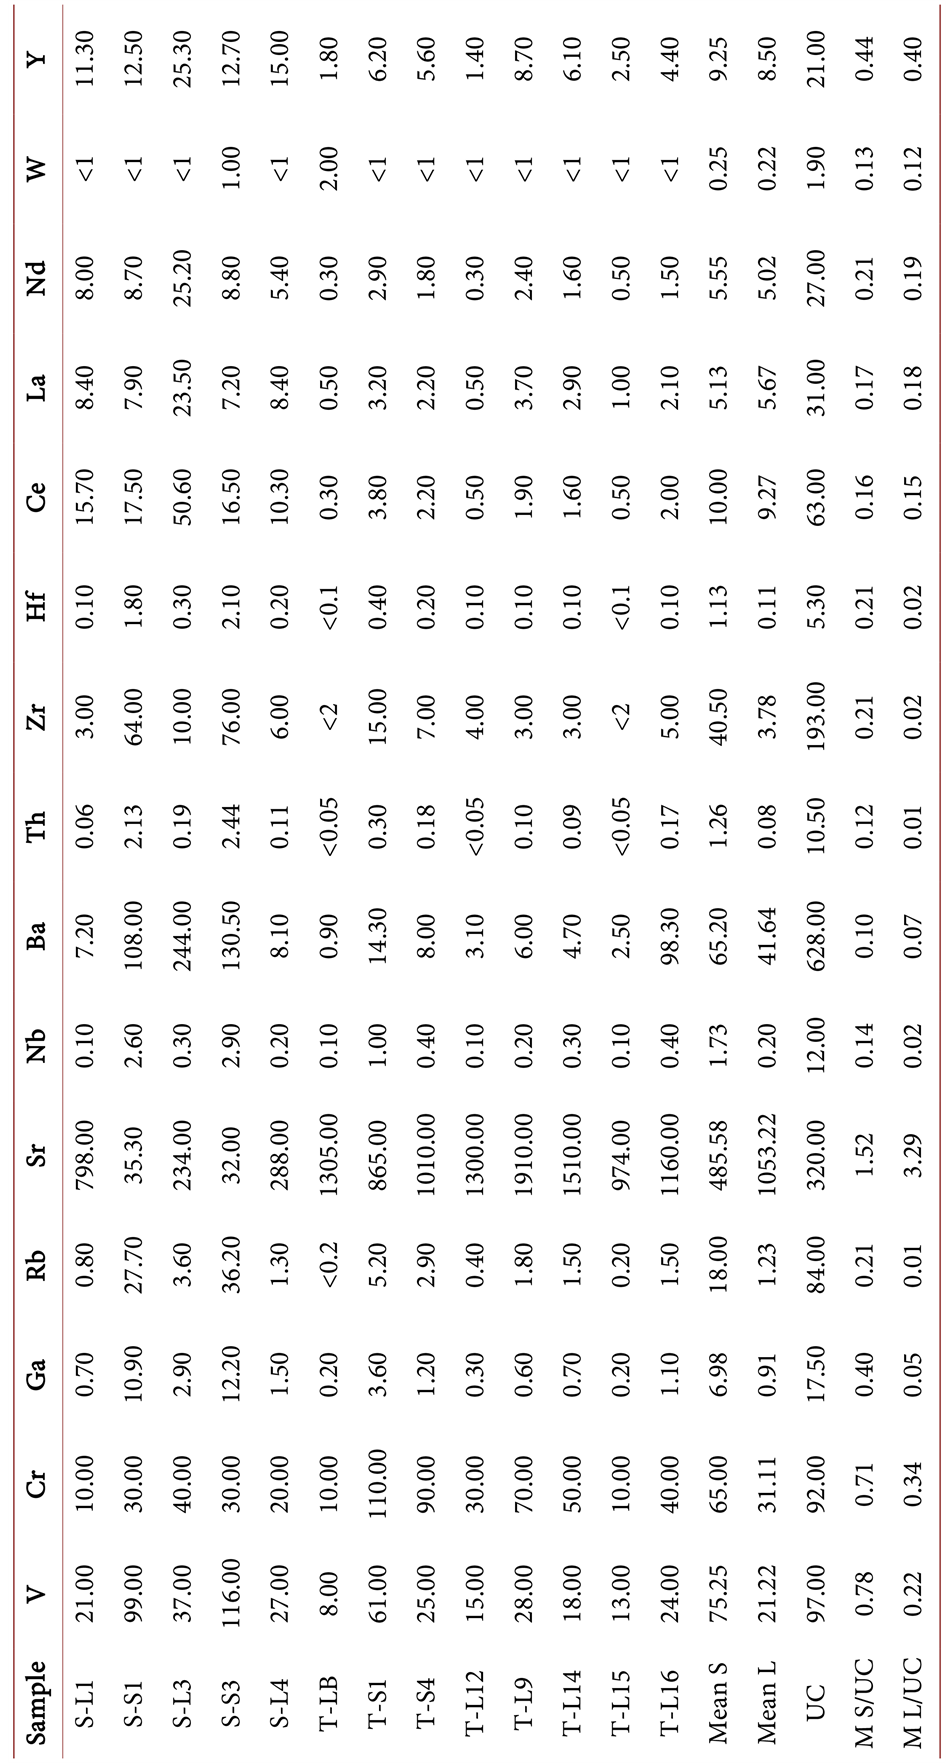
Trace element concentrations of shale and limestone of both locations in Battambang province were obtained from ICP-MS analysis and are presented in Table 2. The concentration of V, Cr, Ga, Rb, Nb, Ba, Th, Zr, Hf, Ce, La, Nd, W, and Y (mean value for shale 75.25, 65.00, 6.98, 18.00, 1.73, 65.20, 1.26, 40.50, 1.13, 10.00, 5.13, 5.55, 0.25, 9.25 and mean value for limestone 21.22, 31.11, 0.91, 1.23, 0.20, 41.64, 0.08, 3.78, 0.11, 9.27, 5.67, 5.02, 0.00, 8.50, respectively) are smaller than those of UC, except Sr which is higher than UC (1.52 for shale, and 3.29 for limestone).
5. Discussion
5.1. Redox Conditions
The Vanadium (V) and Chromium (Cr) are essential indicators for redox conditions to estimate the degree of oxygen dissolved in water during the sediment deposited [15] . Cr is usually incorporated within the detrital clastic fraction of s sediment where it may substitute for Al within clays, be adsorbed, or occur as
Table 2. Trace elements concentrations (ppm) of Somlout and Takream samples.
chromite. Vanadium in contrast may be bound to organic matter by the incorporation into porphyrins and is concentrated in sediments deposited under reducing conditions. The ratio V/Cr has been suggested as an index of palaeo-oxygenation, oxic to anoxic bottom waters environment [15] [16] . It has been proposed that the value of V/Cr ratio is less than 2 suggests the oxic condition (the oxygen concentration range from 2 - 860 ml/L), 2 to 4.25 indicates the dysoxic condition (the oxygen concentration range from 2 - 0.2 ml/L), and more than 4.25 suggests suboxic to anoxic condition [13] [15] [17] . Somlout samples have a V/Cr value ranging from 0.93 to 3.87, shale sample values are 3.30 and 3.87 are suggested as dysoxic conditions and other samples are suggested as oxic conditions (Figure 7(a)). Takream samples have a V/Cr value ranging from 0.28 to 1.30, which is suggested as the oxic condition.
The Uauthigenic value less than 5 ppm, from 5 ppm to 12 ppm, and higher than 12 ppm, indicated oxic, dysoxic, and anoxic conditions, respectively [18] . The average of Uauthigenic of Somlout and Takream samples is equal to 0.42 ppm and 2.28 ppm, respectively, which suggests to oxic condition environment (Figure 7(b)). Moreover, the oxic condition is generally defined as a reducing environment [15] [19] .
5.2. Water Column Environment
The chemical precipitate is resulted from the interaction between sediments and calcium. Calcium is a major chemical constituent of seawater [20] . The Ca/(Fe + Ca) ratios of argillaceous sediments can provide a direct estimate of paleosalinity throughout the fresh water to marine water [16] [20] . The values for modern sea samples are more than 0.8, whereas the values for modern lake samples are less than 0.6 [16] . In addition, [12] [16] suggests that a high Sr/Ba ratio value of more than 0.8 indicates high salinity, while a low Sr/Ba value of less than 0.5 indicates low salinity water or freshwater environment. Shale samples from Somlout have the value of Ca/(Fe + Ca) (Figure 7(c)) and Sr/Ba (Figure 7(d)) range from 0.15 to 0.18 and 0.24 to 0.32, averaging 0.17 and 0.28, respectively, indicating a freshwater lake environment [16] . In limestone samples in this formation range from 0.96 to 0.98 and 0.95 to 110, averaging 0.97 and 49.11, respectively, which suggests high salinity seawater environment. This condition indicated that the lithologies (shale and limestone) in Somlout samples were deposited in two different conditions involving sea-level fluctuation. The Ca/(Fe + Ca) and Sr/Ba value of both calcareous shale and limestone of the Takream sample range from 0.91 to 0.97 and 11.8 to 1450, averaging 0.97 and 387.14, respectively, which indicate a high salinity seawater environment.
5.3. Depositional Setting
The Al2O3/(Al2O3 + Fe2O3) ratio can be used as an index to determine the sedimentary environment, with a value ranging from 0.4 to 0.7 in the oceanic basin, indicating a deep-water, and from 0.5 to 0.9 in the continental margin [16]
![]()
Figure 7. Plotting diagram showing depositional setting of calcareous shale and limestone in Somlout and Takream samples, (a) is V vs. Cr ratio [16] [17] ; (b) is Ca vs. (Fe+Ca [16] [20] ; (c) is Uauthigenic vs. V/Cr [18] ; (d) is Sr vs. Ba ratio, showing water column environment [16] [21] ; E is Fe2O3/TiO2 vs. Al2O3/(Al2O3 + Fe2O3) diagram [16] [22] .
(Figure 7(e)). The concentration of Al2O3 is affiliated with aluminosilicate phases; it is an excellent indicator for terrigenous input, and Fe2O3 and TiO2 are rich in the metalliferous mid-oceanic ridge [22] . Thus, Fe2O3/TiO2 ratio in the mid-oceanic ridge is higher than the continental margin. Moreover, the cross-plot value of Fe2O3/TiO2 with Al2O3/(Al2O3 + Fe2O3) can be used to distinguish the continental margin from the mid-oceanic ridge [16] [22] . The Al2O3/(Al2O3 + Fe2O3) ratio of Somlout samples ranges from 0.50 to 0.66, all falling into the overlapping area of the oceanic basin and continental margin. The Al2O3/(Al2O3 + Fe2O3) ratio of Takream samples ranges from 0.36 to 0.63, mostly falling into or near the overlapping area of the oceanic basin and continental margin.
Based on paleontological aspects, the presence of fusulinid and bivalve shelve was commonly suggested in a shallow water environment [23] [24] , while bryozoan mainly indicated a marine environment [25] , because these types of micro-fossil mostly live in these conditions. The recognized fossils of bryozoans, fusulinids, and small foraminifers, are skeletal or fragmental debris, indicating that the depositional environment must be a barrier [26] . Somlout depositional condition might be a significant regression depending on the lithostratigraphy of limestone at the bottom, followed by shale at the top [26] .
Takream fine-grained shale and limestone are suggested to form in a quiet marine water setting, a lagoon [27] .
6. Conclusion
According to various geochemical elements and the ratios of V vs. Cr, Uauthigenic vs. V/Cr, Sr vs. Ba, Ca vs. (Fe+Ca), and Fe2O3/TiO2 vs. Al2O3/(Al2O3 + Fe2O3) diagram, Somlout, and Takream are deposited in the shallow marine environment. Somlout shales sample was deposited in the dysoxic fresh water of the lake setting during the sea-level drop. Somlout limestones and Takream samples were deposited in high salinity seawater, oxic condition of shallow-marine water. In addition, Somlout limestones consist of fragmental fusulinid foraminifera, bivalve shells fragment, and bryozoan, which are indicated a barrier environment. Meanwhile, Teakream consists of fine-grained shale, and lime mudstone, which are suggested to deposit in a quiet marine setting of the lagoon. In conclusion, Tonle Sap basin sediments were deposited in shallow marine, the barrier and lake environment for Somlout, and the lagoon environment for Takream.
Acknowledgements
This project was funded by the Cambodia Higher Education Improvement Project (Credit No. 6221-KH) and the Laboratory-Based Education Project (LBE) of JICA. The authors would like to thank Faculty of Geo-resources and Geotechnical Engineering of Institute of Technology of Cambodia for laboratory supporting, and the General Department of Petroleum (GDP), the Ministry of Mine and Energy (MME) for fieldwork cooperation.