Characterization of sugar diversity in floral and extra-floral nectar from the Coastal Coral Tree (Erythrina caffra Thunb.) in Southern California ()
In Southern California, the Coastal Coral tree (Erythrina caffra Thunb.) is an exotic myrmecophyte that is native to coastal forests of the Eastern Cape region of South Africa [10]. The Coastal Coral tree produces abundant floral nectar (FN) between the months of winter and early spring [11] and extra-floral nectar (EFN) from calyxine and foliar glands [12]. While the role of FN in Erythrina is to attract pollinators [13,14], the role of EFN glands in myrmecophytes is an active area of research [15].
The literature advances four hypotheses that address the evolutionary role of EFN in myrmecophytes: 1) EFN glands serve as a waste excretion site for the plant, where excess fluids can be eliminated [16,17]; 2) EFN serves as a biotic defense mechanism for myrmecophytes, which attract predatory insects, such as ants, that in turn protect the plant tissues from herbivores [6]; 3) EFN deters ants from tending trophobionts, which feed on plant phloem and secrete honeydew as a reward for ant-provided defense [18]; 4) EFN serves to distract ants from visiting flowers [19,20].
While many studies of myrmecophytes have focused on interspecific surveys of EFN chemical constituents [21], the Costal Coral tree offers an opportunity to conduct intraspecific contrasts of FN and EFN sugar composition. The objective of this study was to use High Performance Liquid Chromatography with Refractive Index Detection (HPLC-RID) to evaluate the retentive identity (i.e. species) and concentration of sugars secreted by both FN and foliar EFN glands on Coastal Coral trees in Southern California. We hypothesized that the richness, relative concentration, and diversity of sugars in FN and foliar EFN would diverge due to differences in the ecological role of the glands.
2. MATERIALS AND METHODS
2.1. Field Sampling
The FN and foliar EFN samples were collected on 8 - 12 April 2013 between 800 - 1100 hrs from five Coral trees located on Loyola Marymount University, Los Angeles CA. The trees were selected based on height (10 – 15 m tall), and growing in a high light environment (i.e. no canopy overlap). A given FN sample was extracted from multiple flowers on a single inflorescence, and stored in a 1.5 ml micro-centrifuge tube. A given foliar EFN sample was collected from the EFN glands on 10 - 15 young expanding leaves from each Coastal Coral tree. The two standard paper-punch sized discs of Whatman chromatography paper were used to dab foliar EFN glands until saturated, and stored in 1.5 ml micro-centrifuge tubes.
2.2. Lab Preparation
To prepare the FN samples, two clean chromatography disc papers were submerged into the micro-centrifuge tubes with the FN that was collected in the field and then resuspended in 0.5 ml of MilliQ water. To prepare the foliar EFN samples, the two original discs collected in the field were resuspended in 0.5 ml of MilliQ water. Both the FN and foliar EFN solutions were vortexed for 3min, and filtered using a 1.2 nylon pore Cameo 25 NS filter.
2.3. HPLC Methodology
Aliquots of 10 μl of diluted FN and foliar EFN were injected into a Waters HPLC system outfitted to a Waters 2414 Refractive Index Detector and a Carbohydrate Analysis Column (WAT084038). The HPLC-RID operated with a mobile phase of 85% acetonitrile, flow rate of 3 ml/min, column temperature of 50˚C, detector temperature of 50˚C, and pressure of approximately 1000 psi. Two runs were conducted for a given nectar sample to ensure consistency of chromatograms, however only one of the runs was integrated to avoid pseudoreplication. Peak integration was conducted with an area method of quantitation using Empower 2 (version 2008).
2.4. Data Analysis
In a chromatogram, sugar species were identified by the retention time (RT) of a given peak. The relative abundance of a sugar species was determined by using the area under a peak. The peak area (μv*s) for a given sugar species was reported as a percent (%) of the total peak area (μv*s) for all of the sugar species in the chromatogram. The richness and relative abundance of sugar species were evaluated for unique and shared sugar species between FN and foliar EFN samples. We evaluated the distribution of the relative abundance of sugar species shared between FN and foliar EFN using a ShapiroWilks test for normality. We compared the mean abundance of shared sugar species between FN and foliar EFN using a Mann-Whitney U test. We used the sugar species richness and relative abundance to calculate a Shannon-Weiner diversity index (H) using equation (1):
 (1)
(1)
where pi is the proportional abundance of the ith species relative to the total abundance of all sugar species [22]. We evaluated the distribution of sugar diversity indices of FN and foliar EFN using a Shapiro-Wilks test for normality. We compared the mean diversity index of sugars detected in FN and foliar EFN using a MannWhitney U test. We compared differences in the variance of sugar diversity indices between FN and EFN using an F-test.
3. RESULTS
There was a total of four sugar species detected between FN and foliar EFN (Figure 1). One sugar species (RT 1.7 min) was unique to FN, two sugar species (RT 1.9 min and RT 2.6 min) were unique to foliar EFN, and one sugar species (RT 1.8 min) was common to both FN and foliar EFN. The peak area for the sugar species RT 1.8 min was not normally distributed (W = 0.8221, P < 0.05). The mean peak area (%) of sugar species RT 1.8min was significantly greater in FN than foliar EFN

Figure 1. The retentive species and relative concentration of sugars detected in FN and EFN secretions. Bars denote 95% Confidence Intervals.
(U = 0.01, P = 0.0122, Figure 2). Sugar diversity index values were not normally distributed (W = 0.5318, P < 0.05). The mean sugar diversity index values of FN did not differ significantly from foliar EFN values (U = 9.0, P = 0.5309, Figure 3). However, the variance of FN sugar diversity index values was significantly lower than foliar EFN values (F = 0.0369, P = 0.0037, Figure 3).
4. DISCUSSION
The HPLC-RID methodology detected a total of four distinct sugar species; one unique to FN (RT 1.7 min), two unique for EFN (RT 1.9 min and RT 2.6 min), and one common to both FN and EFN secretions (RT 1.8 min). The sugar species common to both gland types (RT 1.8 min) was detected in significantly greater concentrations in FN than foliar EFN secretions. While the mean diversity of the sugars secreted did not change between both gland types, the diversity values of foliar EFN sugars were significantly more variable than those of FN sugars.
The intraspecific contrasts of FN and foliar EFN secreted by the Coastal Coral tree revealed that the variability in sugar composition reflected ecological differences in the role of the respective nectar-secreting gland [23,24]. The conserved variance of FN sugar diversity can be attributed to its role in attracting bird and insect pollinators [25], wherein increased variation would negatively impact plant fitness. The greater variance of sugar diversity detected in foliar EFN is expected for a myrmecophytic species that can interact facultatively with a plethora of ant species inside and outside of its native range [26].
Given that the Costal Coral tree is an exotic species, the variability in the diversity of foliar EFN sugars may also reflect conditionality in the cost/ benefit outcome of a facultative mutualism in a non-native abiotic and biotic environment [27-29]. In southern California, reproductively mature Costal Coral trees are found in managed urban habitats, experience low levels of herbivory, and

Figure 2. The relative concentration of sugar species RT 1.8 min in both FN and EFN secretions.
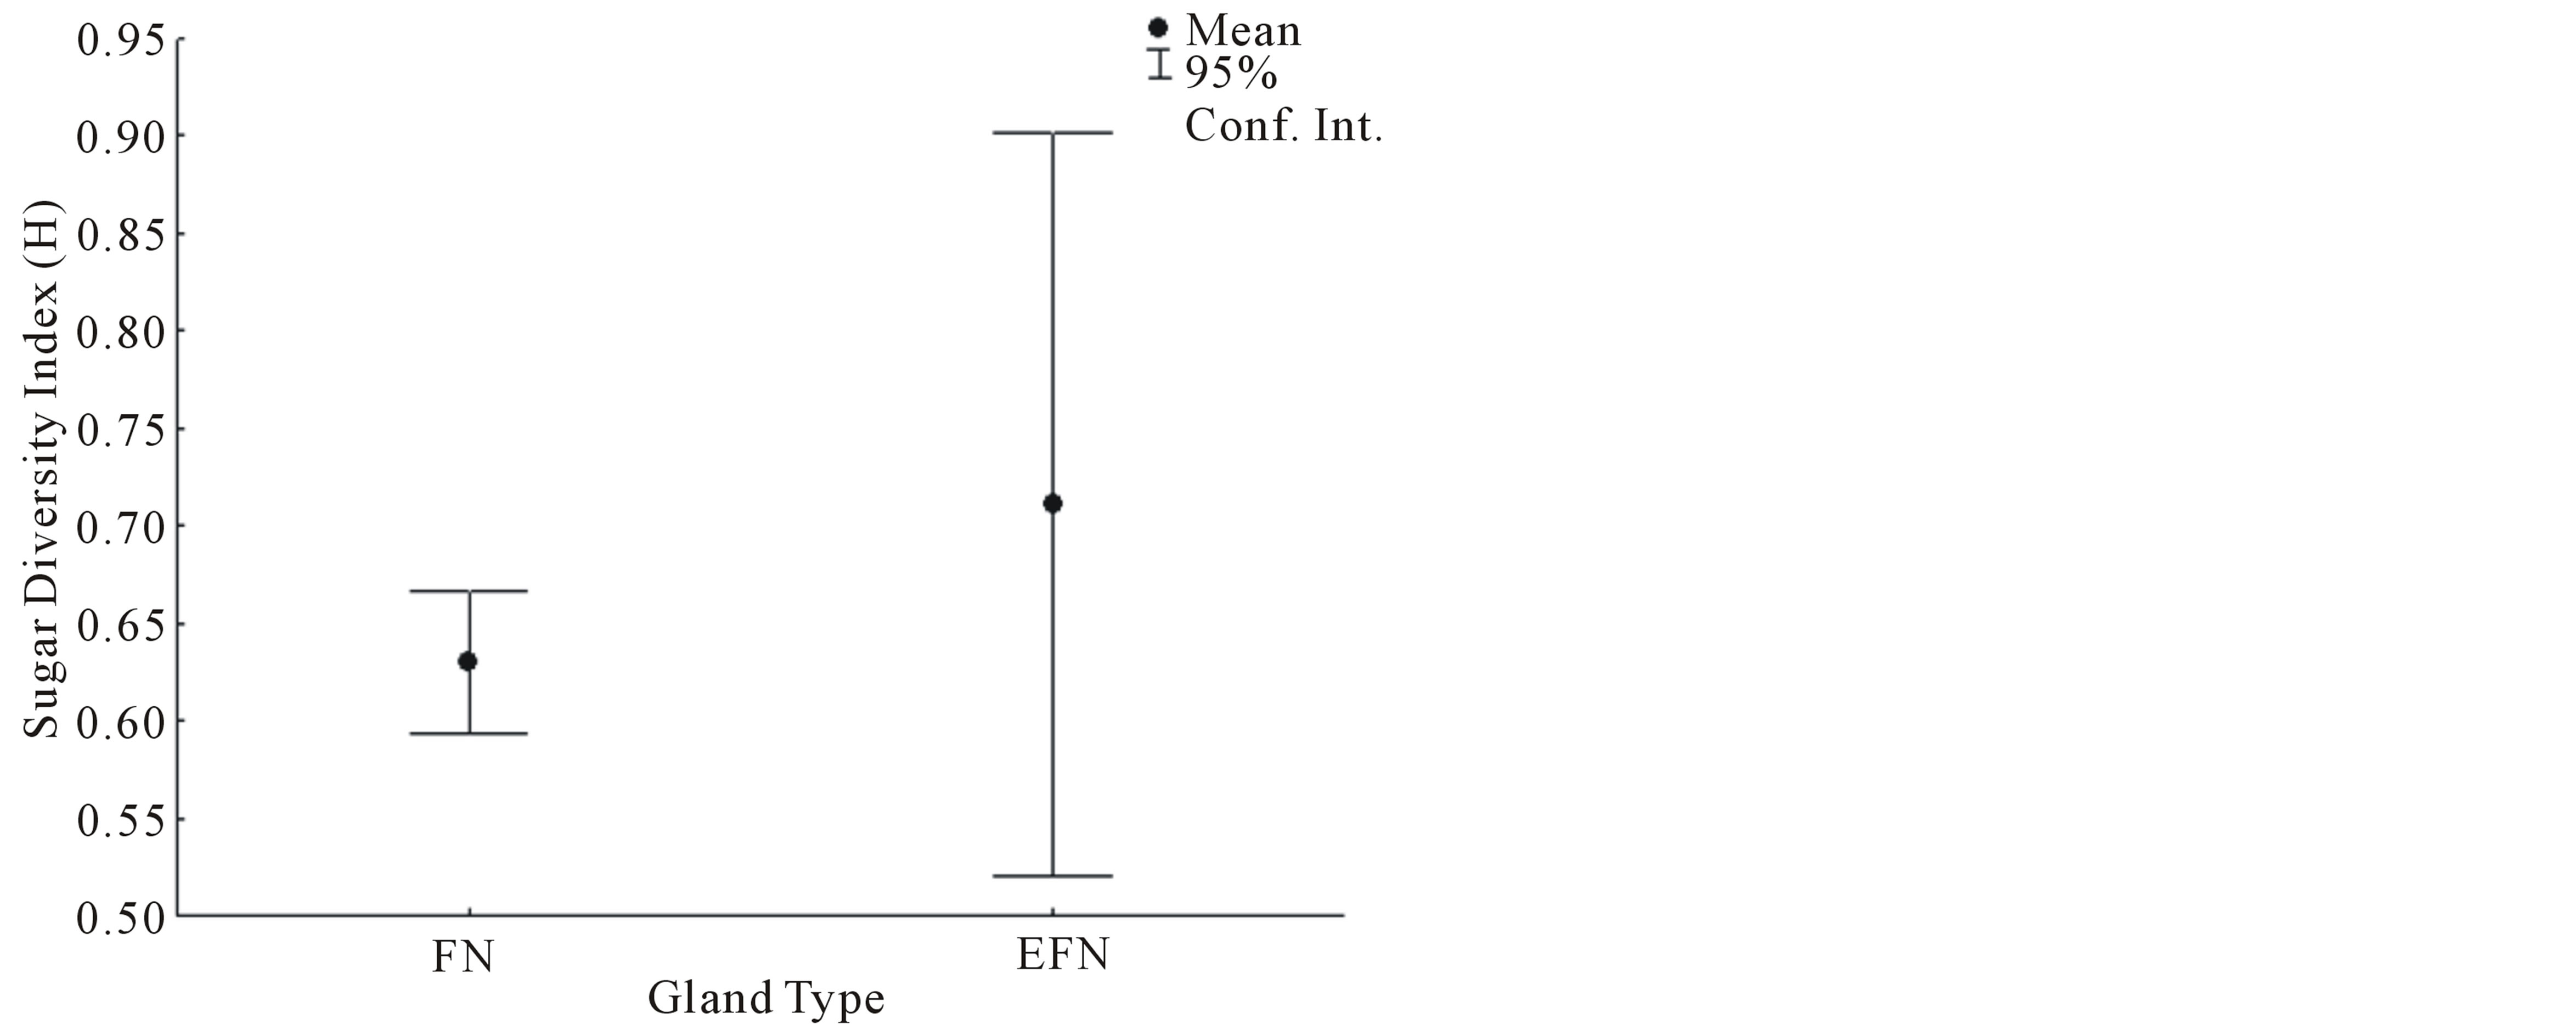
Figure 3. The diversity index values of sugars detected in FN and EFN secretions.
ants are rarely observed visiting foliar EFN glands (pers. obs.). As such, future intraspecific contrasts of EFN gland secretions from exotic Costal Coral trees may expect that the sugar composition from calyxine EFN glands more closely resemble the variability and diversity from foliar EFN glands rather than the conservative FN glands.
ACKNOWLEDGEMENTS
We would like to thank L.G. Carmona Solano for his valuable help with Refractive Index Detection, as well as G. Kuleck and L. Towner for their help coordinating hardware improvements for the Waters HPLC system. This project was supported by a Kadner-Pitts Research Grant from the Loyola Marymount University (LMU) Biology Department and a Continuing Faculty Grant from the LMU Frank R. Seaver College of Science & Engineering. Student support was funded by a grant from the Beta Beta Beta National Biological Honor Society, as well as through stipends from both the LMU Undergraduate Research Opportunities Program and the LMU Summer Undergraduate Research Program.